Scripts on GitHub: the PowerShell scripts, READMEs and test samples used in this post are in cloud-secure-ai/entra-internet-access-inline-dlp.
Summary
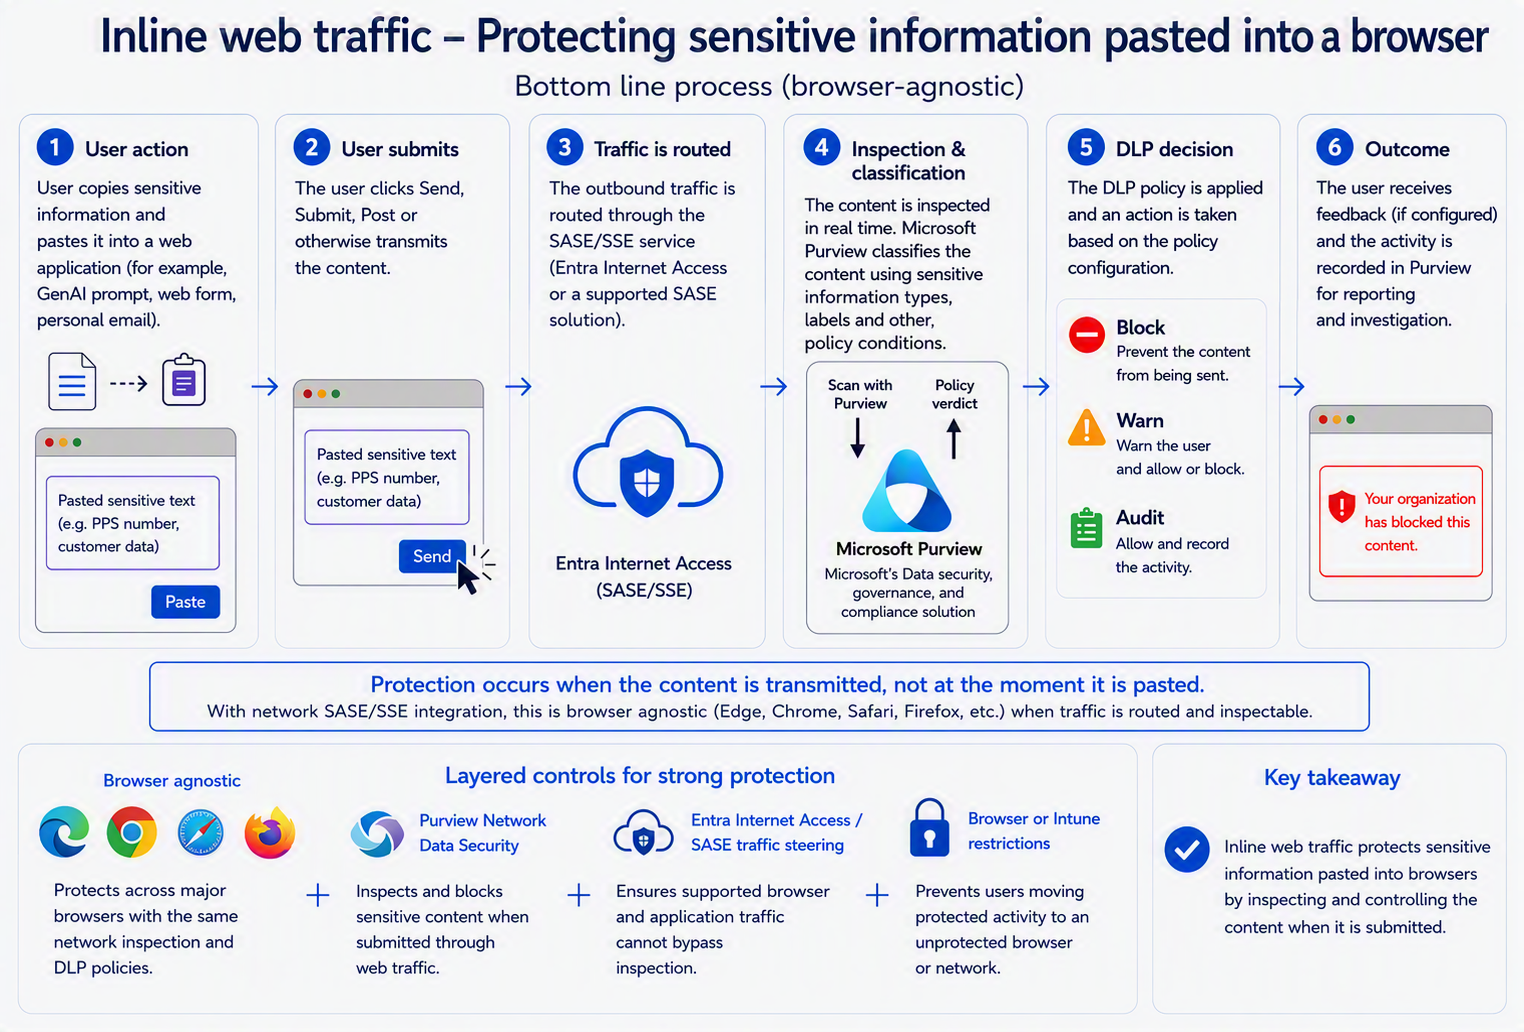
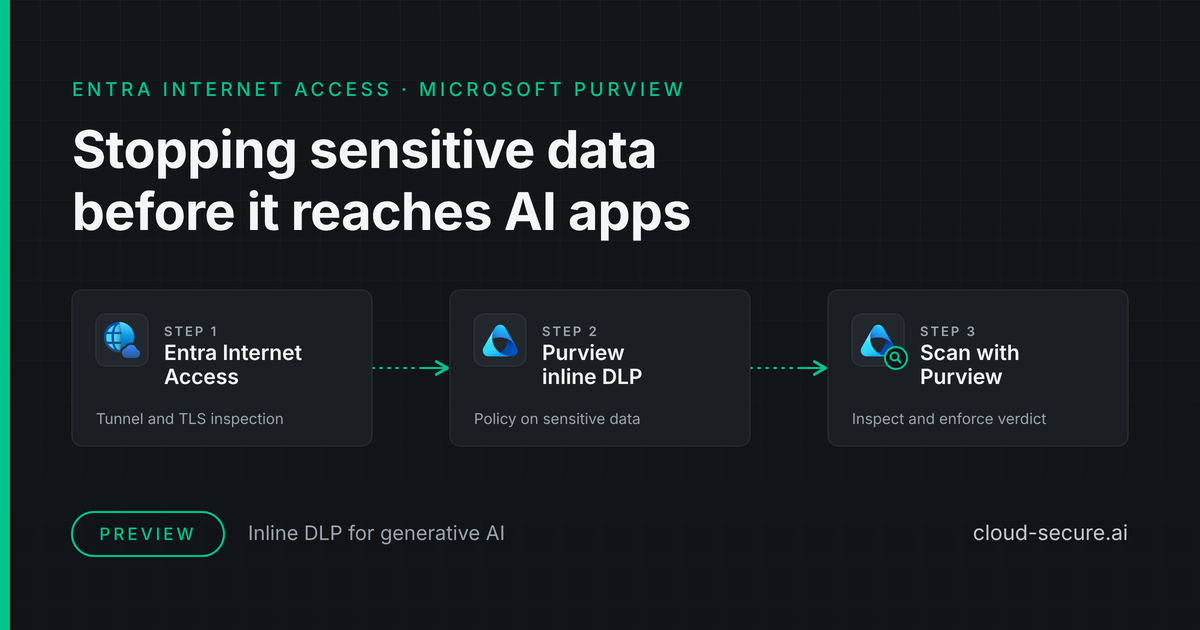
People paste customer lists, contract wording and project codes into ChatGPT and other AI apps every day, often from browsers IT does not control. This post shows how to stop that at the network, before the data leaves: Microsoft Entra Internet Access routes browser traffic through Microsoft’s cloud and decrypts it, then hands the content to Microsoft Purview, which blocks anything matching a sensitive information type. It works in any browser and needs no browser extension.
This post records a working deployment, tested in October 2026. File uploads were blocked on all six applications tested, and typed or pasted prompts on five of six - the exception is Claude, which sends prompts in a binary format Purview can’t read (see Coverage findings).
Every step is shown with screenshots so it can be followed and checked in the portal, and the repeatable parts are scripted - see Scripts. If you are new to Global Secure Access, read the key terms below first.
Key terms
- Global Secure Access (GSA) - Microsoft’s Security Service Edge (SSE): a cloud service that device traffic is routed through so it can be inspected and controlled. Entra Internet Access is the part that handles internet and SaaS traffic.
- Global Secure Access client - the agent on the device that sends its traffic to Global Secure Access.
- TLS inspection - decrypting HTTPS traffic inside Global Secure Access so its content can be read. Devices must trust the inspection certificate, or every inspected site shows a certificate error.
- Microsoft Purview DLP - data loss prevention policies that detect sensitive data and decide whether to allow or block it.
- Sensitive information type (SIT) - the pattern Purview looks for, such as a regular expression plus supporting keywords.
- Scan with Purview - the Global Secure Access content policy action that hands decrypted content to Purview for a verdict.
- Adaptive app scope - a Purview-managed group of applications, such as All unmanaged AI apps, built from the Defender for Cloud Apps catalogue.
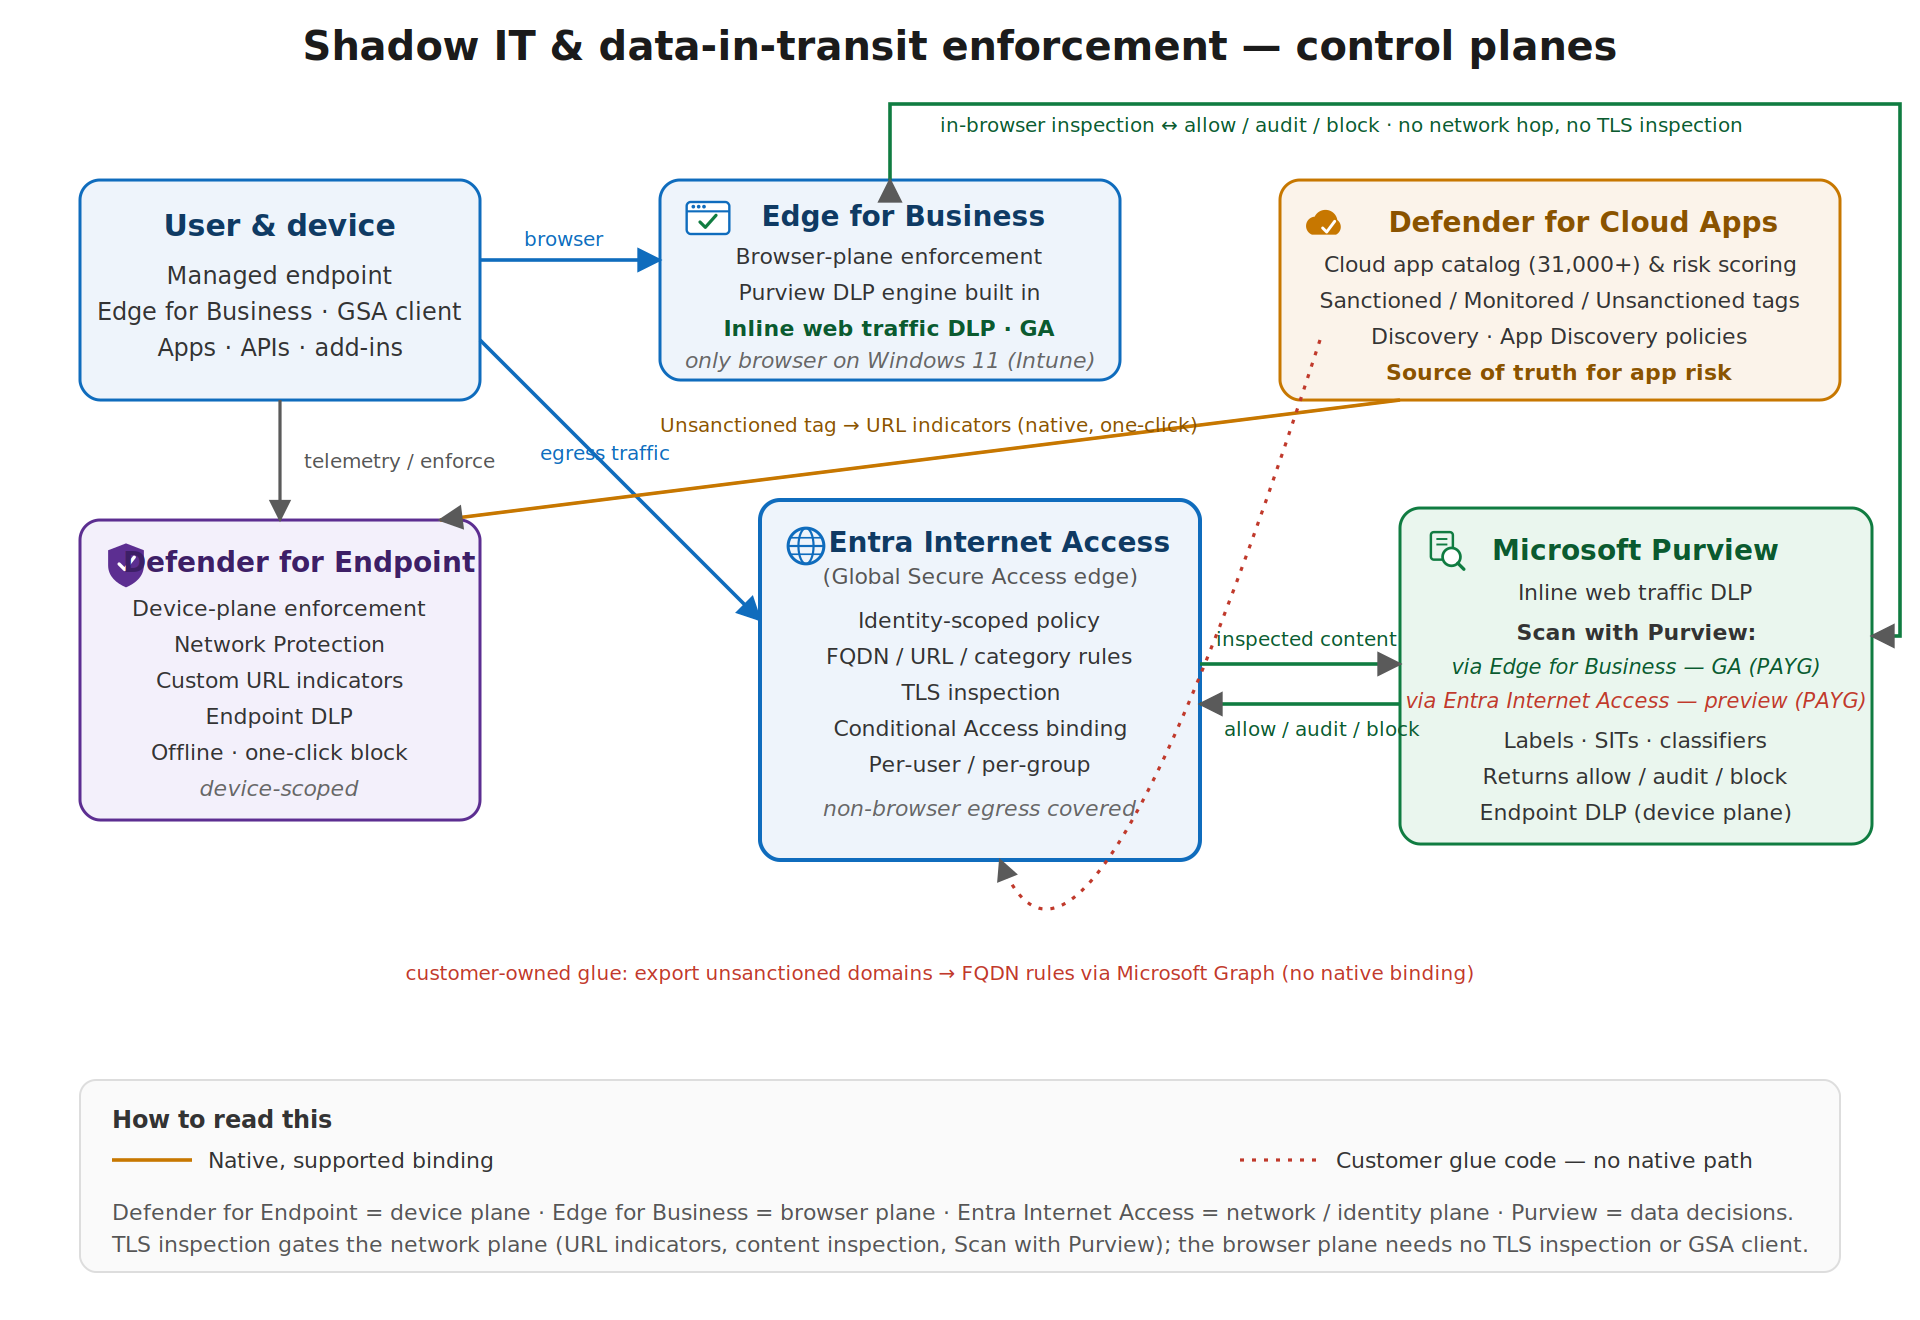
- Enforcement plane - where a DLP policy acts: the browser plane (inside Edge for Business) or the network plane (Global Secure Access, used here).
- QUIC - the UDP-based protocol behind HTTP/3. Global Secure Access can’t inspect it, so it must be turned off in browsers.
Purpose and scope
This post sets out how to deploy Microsoft Purview inline DLP over Microsoft Entra Internet Access, and how to verify that it actually protects a given generative AI application. Specifically, it covers the Network and non-Microsoft secure browsers option on the DLP policy’s Choose where to enforce the policy page, with Edge for Business left off (see Architecture).
It is written for engineers and architects deploying the control in their own tenant or in customer tenants. It assumes working knowledge of Entra ID, Conditional Access, Intune and Purview; the key terms above cover the rest.
The scope is the network enforcement plane: sensitive data leaving the organisation through unmanaged cloud and generative AI applications, inspected at the network layer rather than in the browser. Prompt injection protection, which inspects content going to the model rather than data leaving the organisation, is a separate Global Secure Access feature with its own prompt policies and is out of scope.
Coverage is not uniform across applications. The Coverage findings section sets out tested results, and Known limitations and residual risk sets out what remains; both should be read before the control is presented to a customer as complete.
Architecture
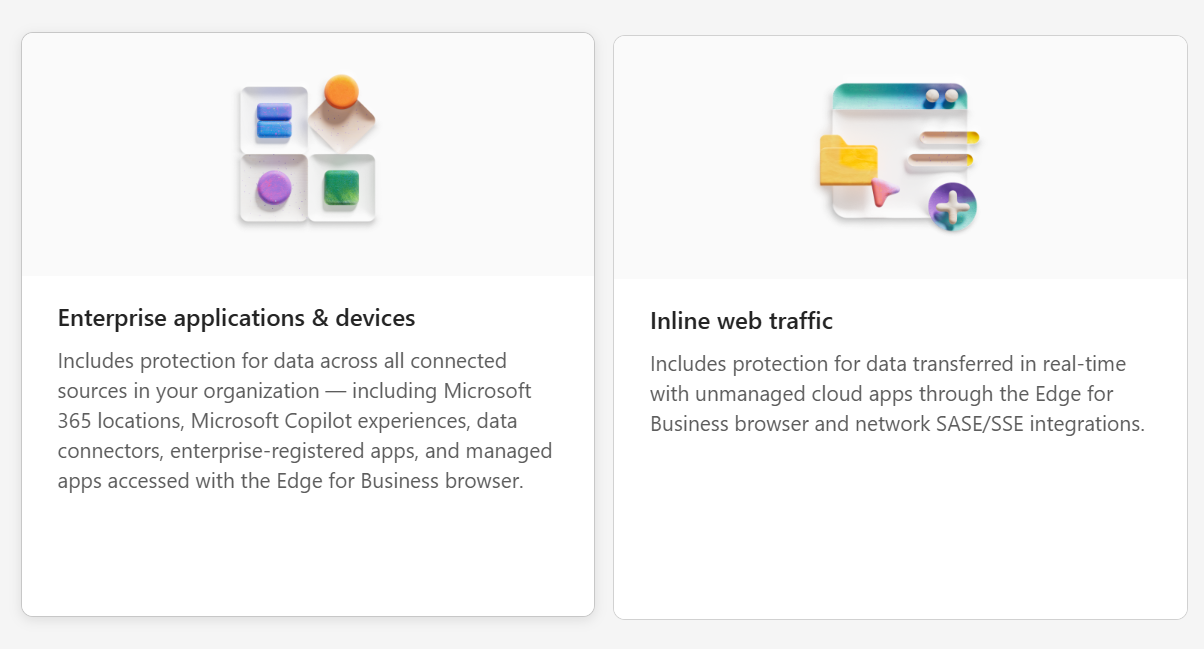
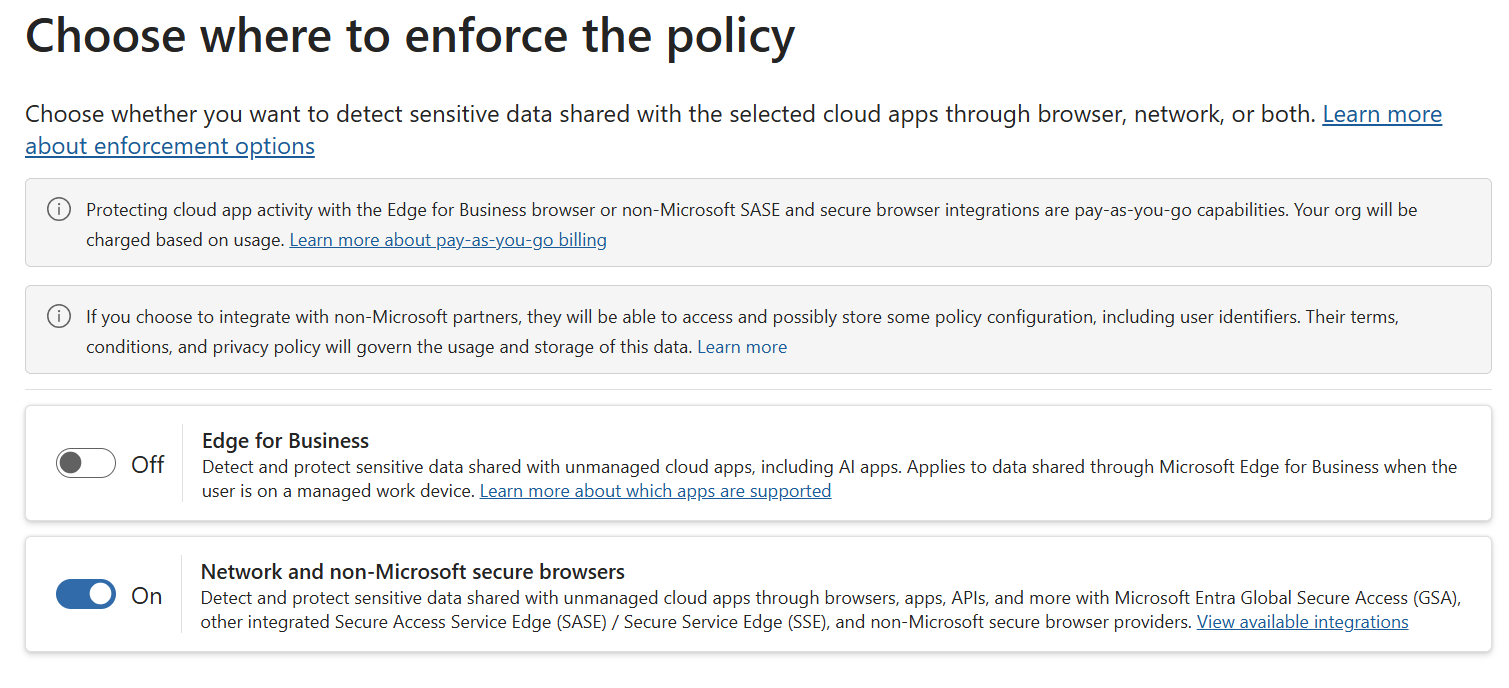
In the Purview DLP policy wizard, the Choose where to enforce the policy page offers two options. This post is about the second one.
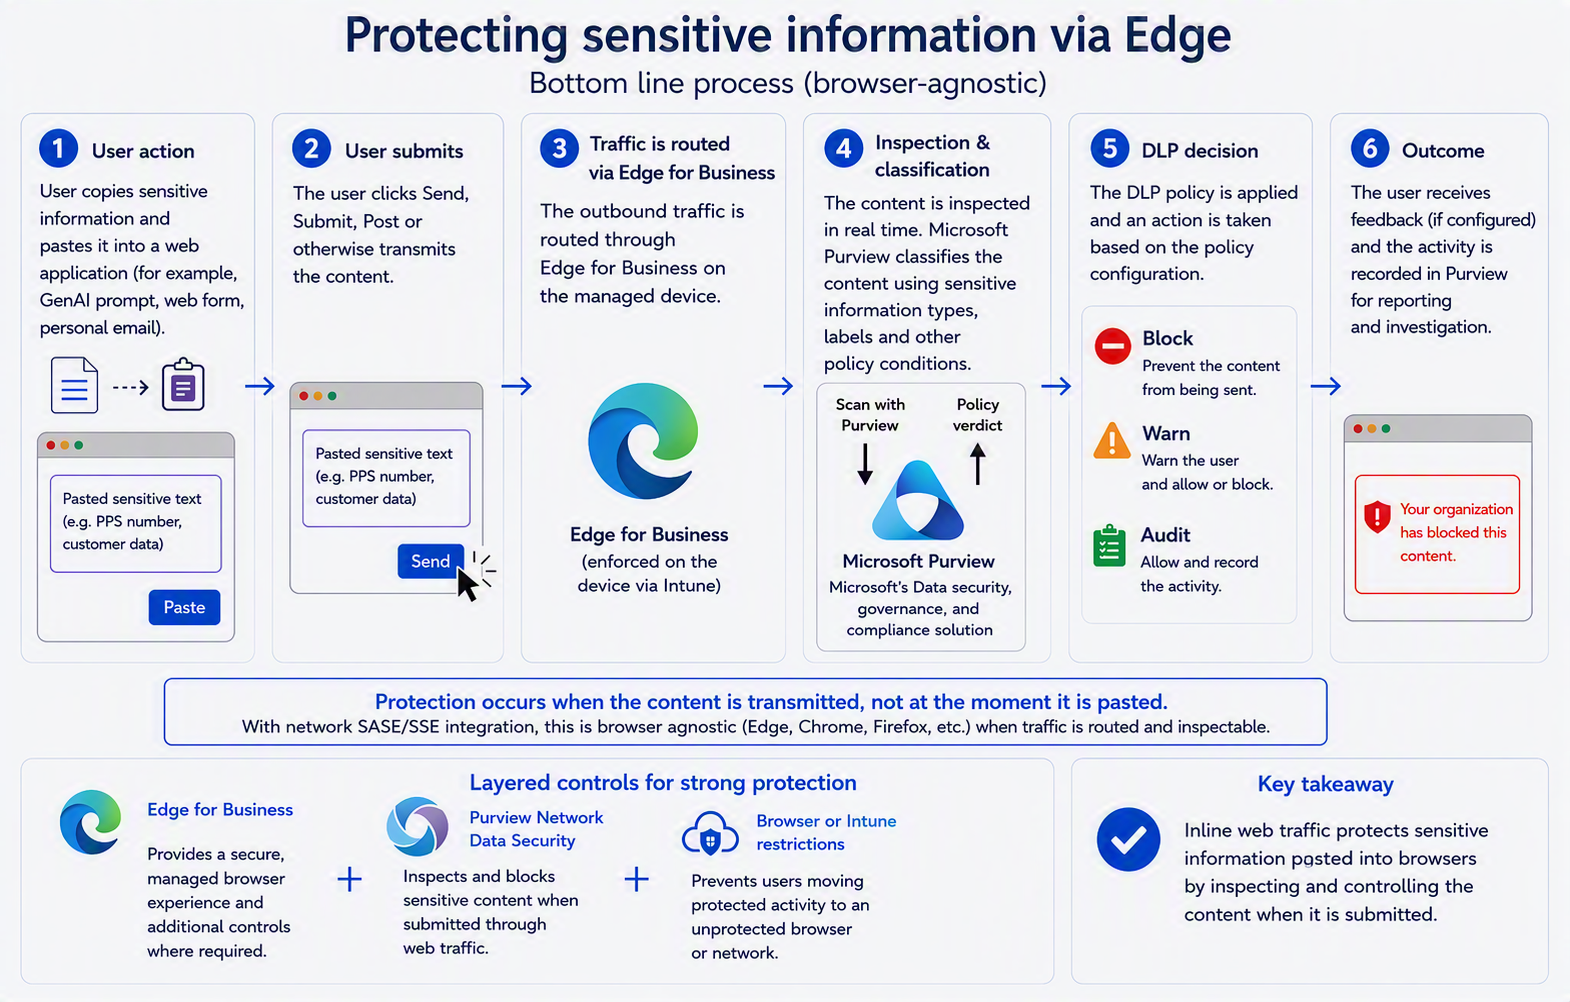
- Edge for Business - inline protection built into Microsoft Edge for Business on managed work devices, for a published list of supported apps. It is also a pay-as-you-go capability, and to be effective Edge must be the default browser with third-party browsers blocked; otherwise a user can simply switch browser.
- Network and non-Microsoft secure browsers - inspection in the network path through Global Secure Access, using Scan with Purview. It works in Chrome, Firefox and any other browser, as well as Edge, and covers any application in the Defender for Cloud Apps catalogue.
This post configures Network and non-Microsoft secure browsers on its own, with Edge for Business left off. It is aimed primarily at browsers other than Edge: organisations that can’t or won’t standardise on Edge and block every other browser still get the same protection, whichever browser people use.
Global Secure Access acquires the traffic, terminates TLS, and passes the decrypted payload to Purview for classification. Purview returns a verdict and Global Secure Access enforces it. Because enforcement happens at the network layer, a block is returned as an HTTP 403 and the application renders whatever error it chooses.
How Scan with Purview works
Preview. At the time of writing (October 2026), Scan with Purview - the Purview DLP integration with Entra Internet Access - is still in preview. Microsoft’s message centre post MC1181769 schedules general availability to roll out between the end of September and the end of October 2026, so confirm the status in the tenant before presenting the control to a customer as generally available.
Scan with Purview is the link between the two services. Global Secure Access carries and decrypts the traffic; Purview decides whether the content may leave. Neither does the other’s job: Global Secure Access doesn’t classify content, and Purview can’t see network traffic unless Global Secure Access hands it over.
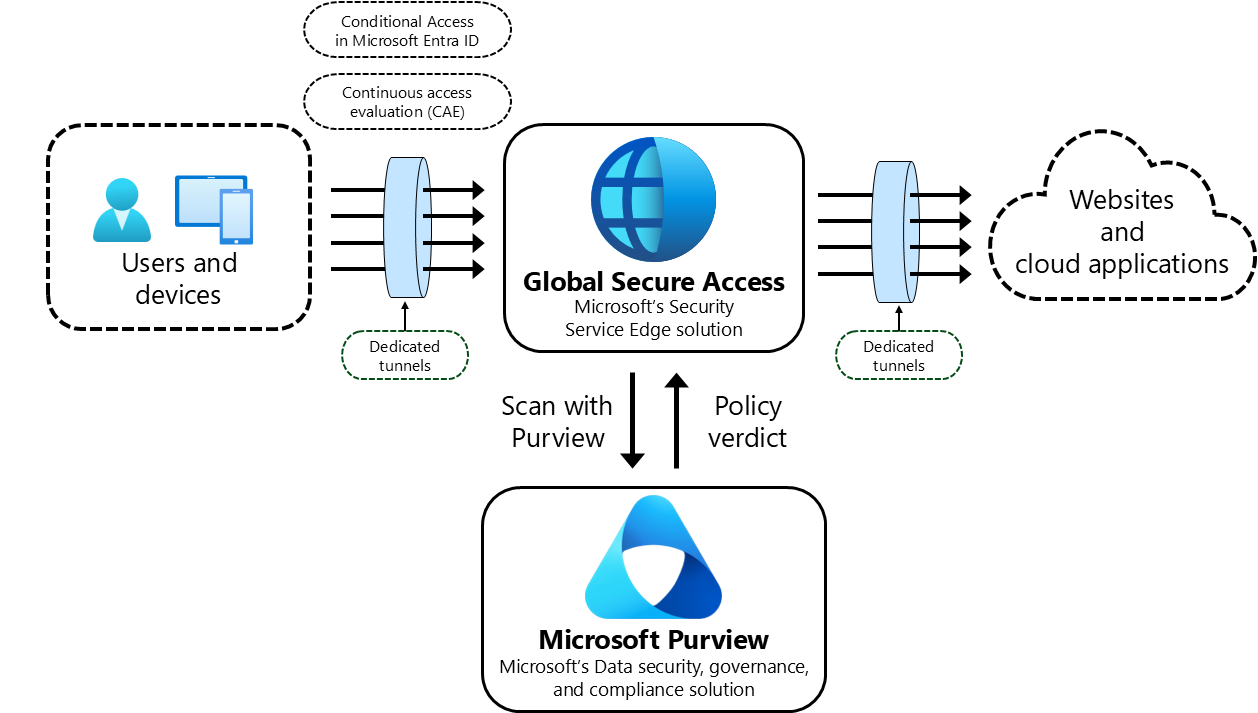
- Acquire. The Global Secure Access client sends the device’s traffic through a dedicated tunnel to Global Secure Access, Microsoft’s Security Service Edge. Conditional Access decides which security profile applies to the user, and continuous access evaluation (CAE) keeps that decision current during the session.
- Decrypt. TLS inspection terminates the connection so the request body - a prompt or an uploaded file - can be read. Without TLS inspection there is nothing to scan.
- Hand over. A content policy rule with the action Scan with Purview passes the decrypted content to Purview. With Use destinations and activities defined in Purview selected, the Purview adaptive app scope decides which applications are in scope.
- Classify and decide. Purview checks the content against the sensitive information types in the inline web traffic DLP policy for that user, application and activity, and returns a verdict - allow, audit or block.
- Enforce. Global Secure Access applies the verdict. An allowed request continues through the outbound tunnel to the website or cloud application; a blocked one gets an HTTP 403, and the application shows its own error.
- Record. The request appears in the Global Secure Access traffic logs, and a match appears in Purview Activity explorer and as a DLP alert - the three logs used in Validation.
What Purview can read. Text sent as JSON, plain text, HTML or XML, and supported file formats, up to 3 MB for both text and files through Scan with Purview. Content Purview can’t parse, such as a prompt sent as binary Protocol Buffers, passes without a verdict. That is why Claude’s file uploads are blocked but its typed and pasted prompts are not (see Coverage findings).
Fail-open. If Purview can’t complete an inspection - the content is too large, for example - the traffic is allowed. These transactions can be found in the traffic logs using the PurviewStatus field.
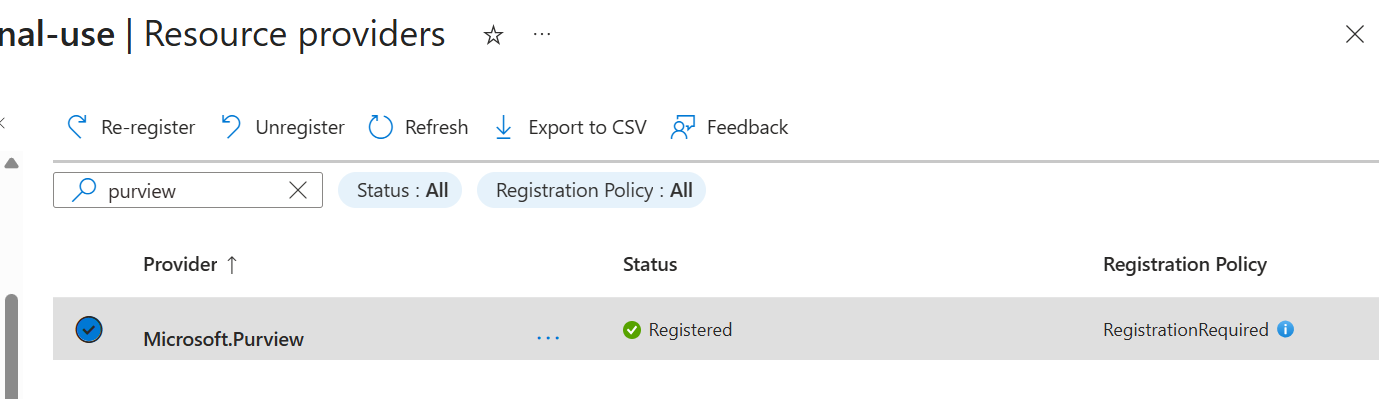
Requirement specific to this path. The Azure subscription behind Scan with Purview must have the Microsoft.Purview resource provider registered. Otherwise traffic reaches Purview and no verdict comes back (see Common failure modes).
Prerequisites
Licensing requires one of two combinations per user: Microsoft 365 E7, or Purview E5 (or equivalent) plus Entra Internet Access. Purview pay-as-you-go billing must also be set up before Step 10: the DLP policy wizard only offers the Network enforcement option once it is. Microsoft’s setup guide is linked under Microsoft documentation.
| Requirement | Detail |
|---|---|
| Licensing | M365 E7, or Purview E5 + Entra Internet Access |
| Roles | Global Secure Access Administrator; Conditional Access Administrator; Intune Administrator; a Purview role able to create DLP policies |
| Graph scopes (read) | NetworkAccess.Read.All, Policy.Read.All, Directory.Read.All, Group.Read.All, DeviceManagementConfiguration.Read.All |
| Tenant state | Global Secure Access onboarded; Internet Access traffic forwarding available |
| Endpoints | Windows 11, Intune-managed, Global Secure Access client installed |
Constraint 1 - B2B guest users are out of scope
Microsoft Purview network and browser data security policies do not apply to B2B guest users. A guest signed in with an external identity is not evaluated, regardless of the device they are using or the policy scope.
This matters more than it first appears. Many organisations onboard contractors, consultants and partner staff as guests precisely so they can be managed centrally. Those users are frequently the ones handling material a customer would most want protected, and they fall outside this control entirely.
Three practical responses:
- Where external staff handle sensitive material regularly, issue member accounts rather than guest accounts. This is the only option that brings them into scope.
- Where guest access must remain, do not rely on DLP for that population. Use web content filtering to block the generative AI category outright for guests, which is an access control rather than a content control and does apply.
- State the exclusion explicitly in any coverage statement given to a customer. A claim that sensitive data is blocked from AI applications is incorrect for the guest population, and discovering that during an incident is considerably worse than disclosing it during design.
Constraint 2 - group membership and assignment surfaces
The solution assigns objects across three surfaces, and they do not use the same kind of group:
| Object | Assigned to | Group type |
|---|---|---|
| Intune trusted certificate profile | Devices | Device group |
| Intune QUIC settings catalog policy | Devices | Device group |
| Conditional Access policy applying the security profile | Users | User group |
| Traffic forwarding profile | Users or devices | Either, depending on configuration |
A device missing from the device group receives neither the root CA nor the QUIC policy. A user missing from the user group is never scoped into the security profile. Both produce the same end-user symptom - nothing is blocked - and neither surfaces as an error anywhere in the console.
Reading Intune assignment status correctly. The check-in status on a configuration profile reports four counts: Succeeded, Error, Conflict and Not applicable. Those counts describe devices that were targeted. A profile targeting devices that cannot apply it reports a non-zero Not applicable. A profile targeting nothing at all reports:
- Succeeded: 0
- Error: 0
- Conflict: 0
- Not applicable: 0
All four at zero is not a healthy profile with nothing to do. It means the profile has no targets, either because no assignment exists or because the assigned group is empty. There is no warning, no amber state and no message; the page looks the same as a profile that has simply not been picked up yet.
Verify membership directly rather than inferring it from assignment reporting. On the endpoint, confirm the certificate is present in the Local Computer trusted root store and that chrome://policy or edge://policy shows QuicAllowed applied as a machine policy. Those two checks confirm delivery in a way the Intune console does not.
Building a test lab
If you are proving the control in a lab before production, three prerequisites are easy to overlook, and each produces a failure that looks like a policy problem rather than a setup problem.
Lab build
| Component | Requirement |
|---|---|
| Test endpoint | Windows 11 VM, Entra-joined and Intune-enrolled, member of the group used for all assignments |
| Azure VM | Microsoft Entra ID login extension installed. The test account needs the Virtual Machine User Login or Virtual Machine Administrator Login role. Entra Internet Access policies are identity-based, so the test server must be signed in with an Entra ID identity. |
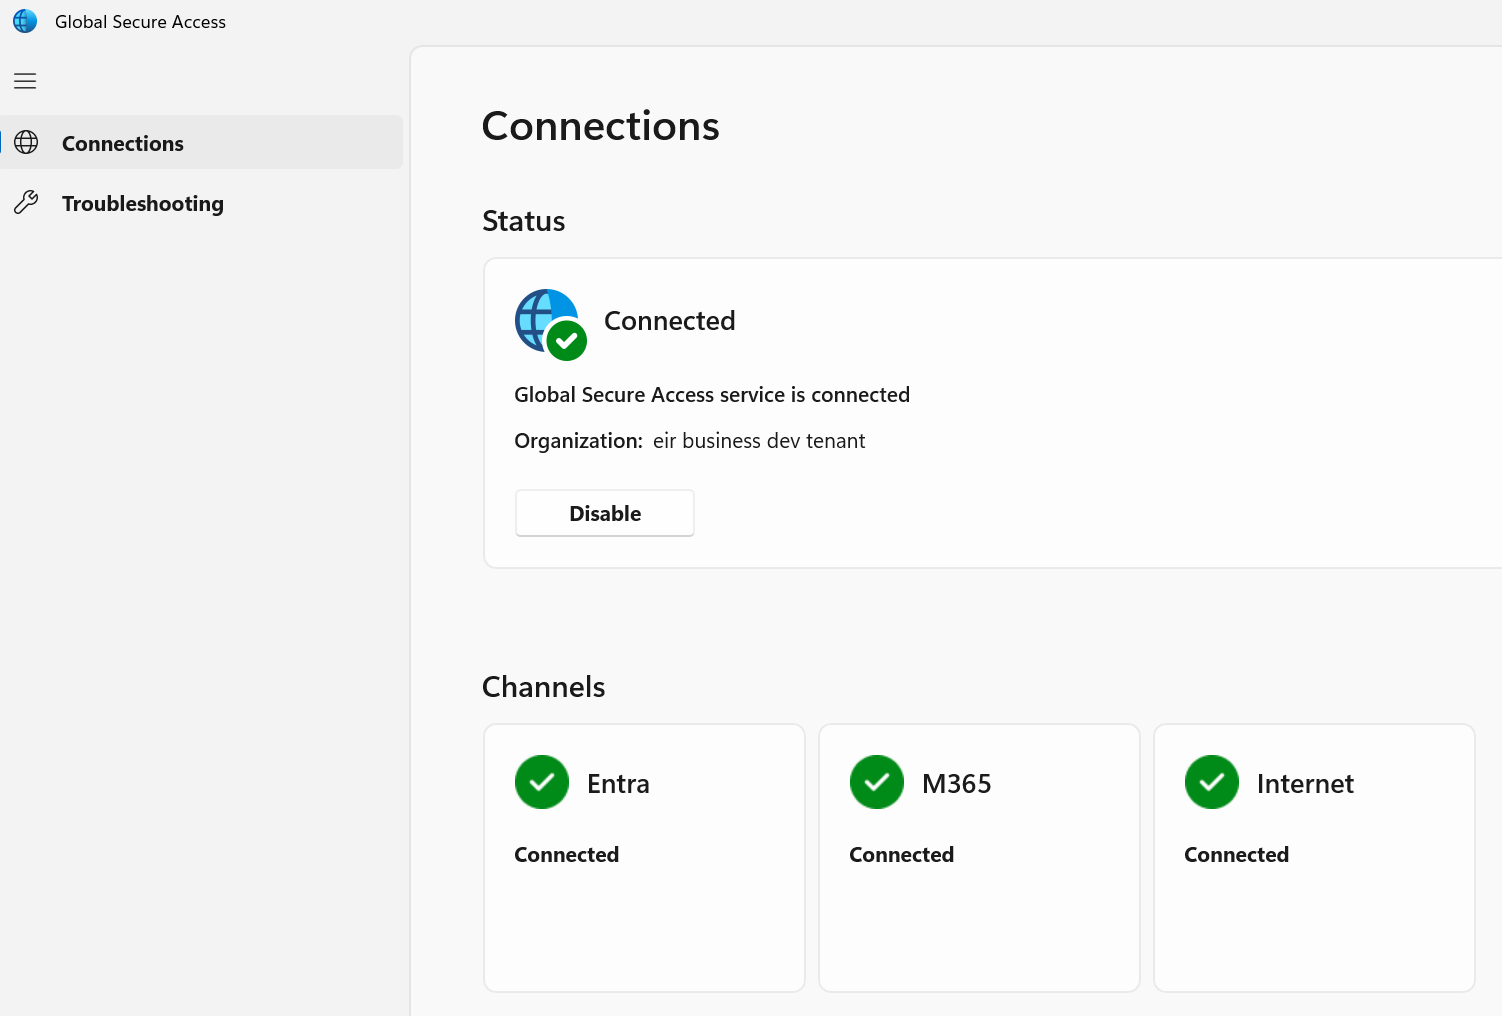
| Test identity | An Entra account licensed for Entra Internet Access. Sign in to the Global Secure Access client with that identity - an unlicensed account leaves the client showing connected while the traffic is never acquired |
| Azure subscription | The subscription backing Scan with Purview must have the Microsoft.Purview resource provider registered. Subscription > Settings > Resource providers |
| Sensitive information type | A custom SIT with a distinctive pattern unlikely to occur naturally, so matches are unambiguous |
Test artefacts
Prepare two items carrying the same sensitive information type:
- A short text string for pasting into prompt boxes.
- A Word document containing that string in its body, kept under 3 MB. Place the value in the body rather than only the filename or document properties, and put a keyword (for example “project reference”) next to it. Repeating the value raises the instance count, not the confidence level - without a keyword it only matches at Medium.
Test matrix
Run each row in Edge and Chrome, signed in to the application, and capture the traffic log evidence for each.
| Test | Expected observation |
|---|---|
| Paste the string into the prompt | Blocked where the application submits JSON; passes where it submits a binary transport |
| Upload the document | Blocked - multipart/form-data is parseable |
| Paste the document’s contents into the prompt | Same result as the paste test, not the upload test |
The third row is the one worth running explicitly. It is the natural user response to a refused upload, and on an application with a binary transport it succeeds where the upload failed.
Isolating the result
Disable or remove any Edge for Business DLP policy before testing the network plane, and confirm in Activity Explorer that the enforcement plane reads network. With both planes active, a browser-plane block is easily attributed to the network policy under test.
Other controls in the lab - Defender for Cloud Apps policies, Defender network protection - can block an application before the request reaches Global Secure Access. Confirm the application loads and a benign prompt succeeds before introducing the sensitive information type.
Implementation sequence
The order matters. Enabling TLS inspection before the root CA is trusted breaks every inspected site for users in scope.
Automate it: steps 3 and 4 (Deploy-GsaEndpointPrereqs.ps1), step 9 (Import-ContosoSIT.ps1) and step 10 (New-PurviewInlineDlpPolicy.ps1) can be run with the scripts in the GitHub repository. Each script has its own README. The steps below show the same configuration manually so it can be checked in the portal.
Before you start
Have these in place before Step 1. Each one, if missed, shows up later as “nothing is blocked” with no error to explain why.
- Licences assigned to the pilot users (see Prerequisites).
- Purview pay-as-you-go billing set up, linked to an Azure subscription in the same tenant. Only a Global Administrator can do this; see Microsoft documentation.
- Microsoft.Purview resource provider registered on that subscription: Azure portal > Subscriptions > your subscription > Settings > Resource providers. Without it, traffic reaches Purview and no verdict comes back.
- Two pilot groups: a device group for the Intune profiles and a user group for Conditional Access, with the same people and devices in both (see Constraint 2).
- Test devices: Windows 11, Entra joined or hybrid joined, Intune-enrolled, with the Global Secure Access client installed.
- Roles: Global Secure Access Administrator, Conditional Access Administrator, Intune Administrator, and a Purview role that can create DLP policies.
- The scripts, if you are using them, downloaded from the GitHub repository.
Step 1 - Enable Internet Access traffic forwarding
Global Secure Access > Connect > Traffic forwarding: enable the Internet access profile and assign it to the pilot users or groups. Deploy the Global Secure Access client to the test devices and confirm it shows Connected against the correct tenant. In the client’s Advanced diagnostics > Forwarding profile, Internet Access rules should appear; this can take up to 15 minutes.

Step 2 - Create the TLS inspection certificate
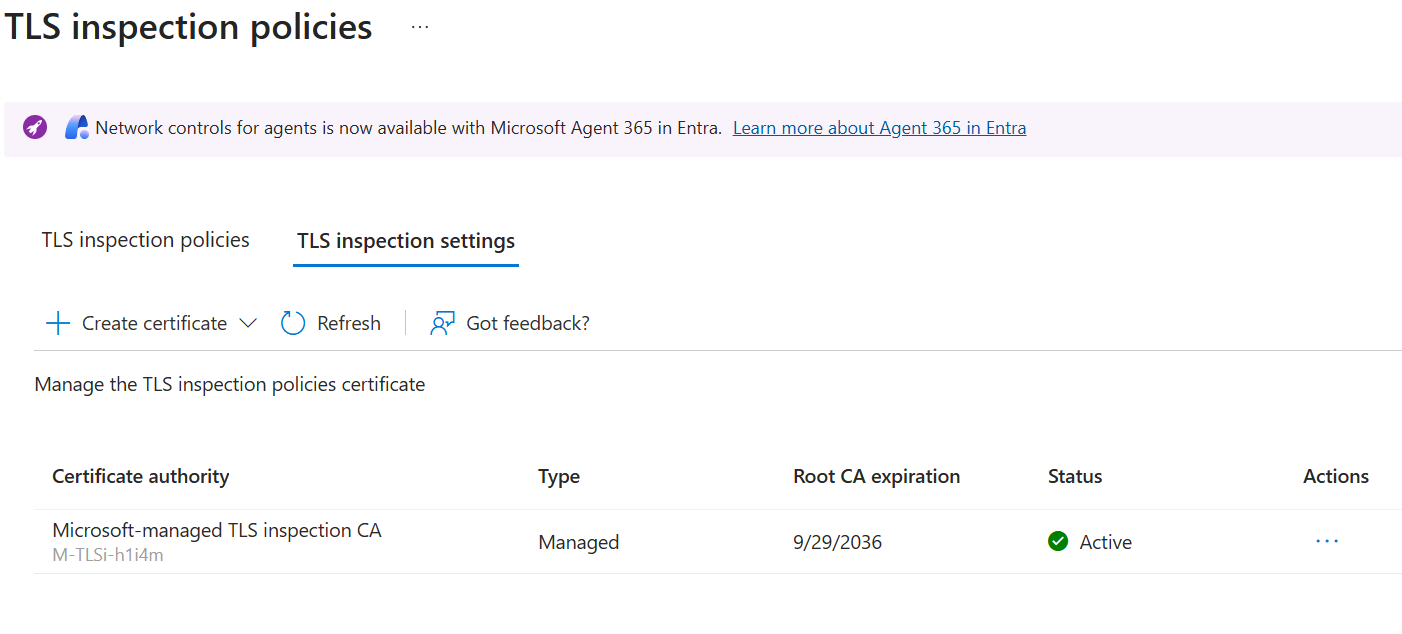
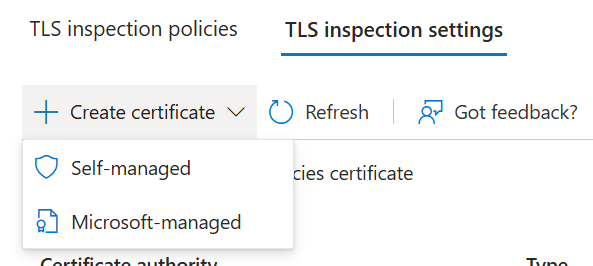
Global Secure Access > Secure > TLS inspection policies > TLS inspection settings > Create certificate > Microsoft-managed. Microsoft generates a tenant-specific root CA and retains the private key. Alternatively, generate a CSR and sign it with the organisation’s own PKI.
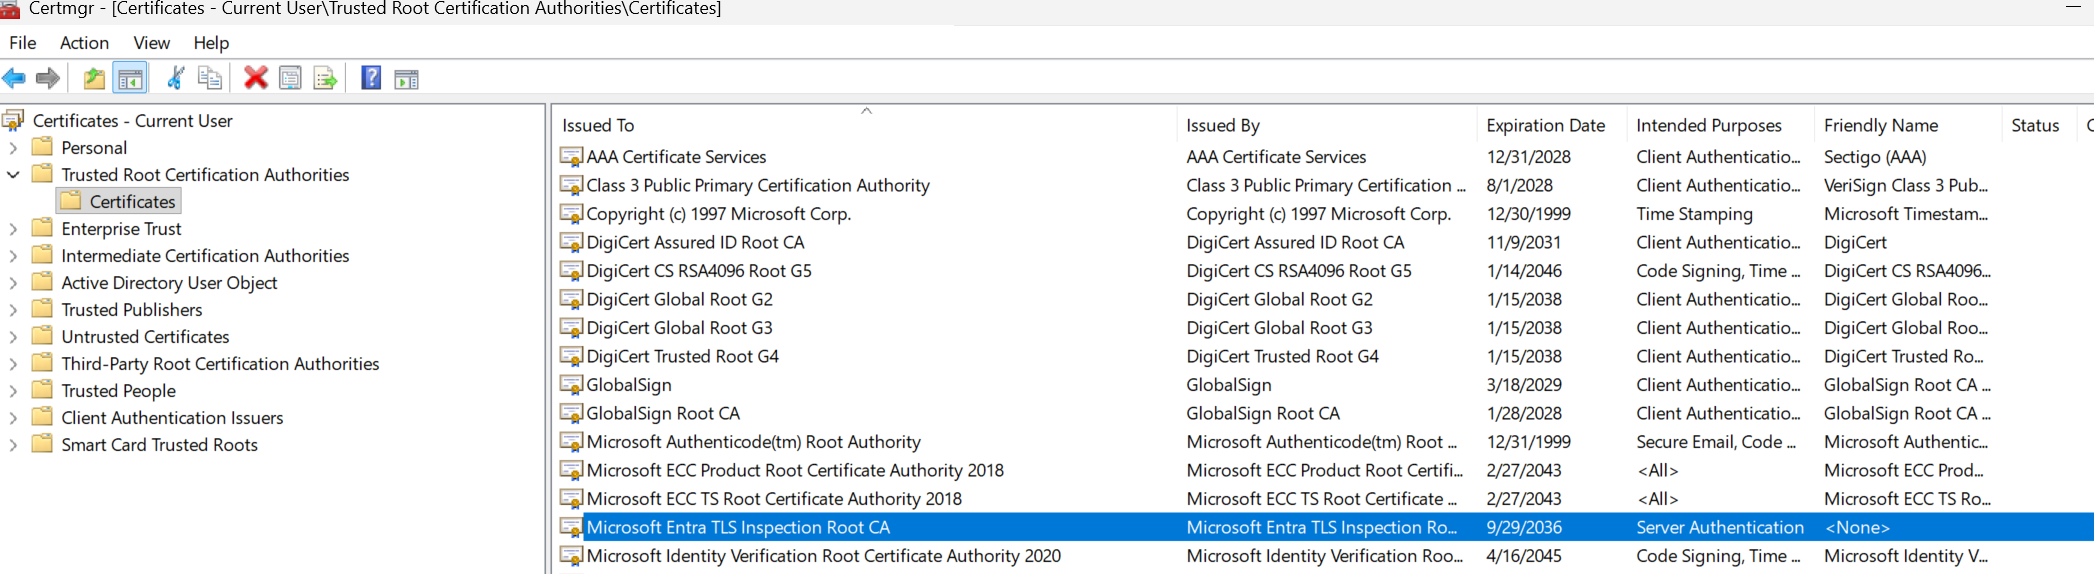
Why this step stays manual. Microsoft generates a unique certificate authority every time a certificate is created. The root downloads as M-TLSi-<id>-root.cer (for example M-TLSi-h1i4m-root.cer), and the <id> changes with each new certificate, including a rotation. It can’t be copied from another tenant or recreated from a template, and the published Graph API only covers the own-PKI (CSR) flow. Create it here, then use … > Download root certificate.
In the portal the certificate always appears as Microsoft-managed TLS inspection CA, with its ID underneath (for example M-TLSi-h1i4m), type Managed and status Disabled. Note the ID and the Root CA expiration date, and leave the certificate disabled until Step 3 is complete.
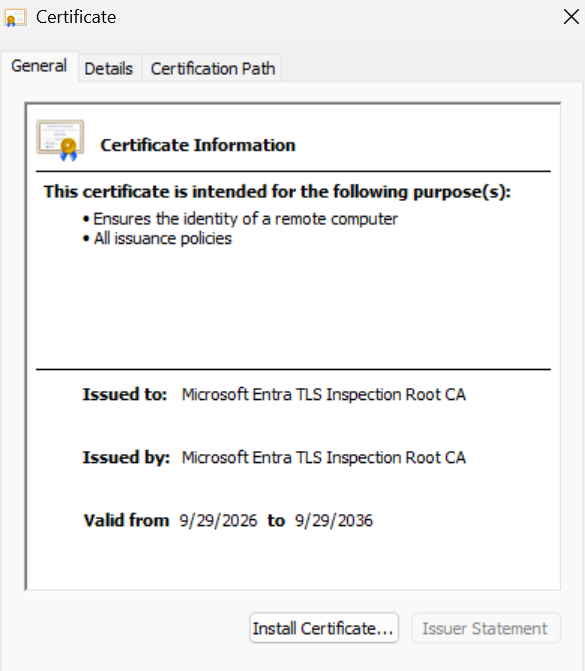
Microsoft-managed certificates aren’t exposed through Microsoft Graph. Tested in October 2026, /beta/networkAccess/tls/externalCertificateAuthorityCertificates returned an empty list while the certificate was Active - that endpoint only holds own-PKI (CSR) certificates. So Deploy-GsaEndpointPrereqs.ps1 can’t look the certificate up by its display name. It works from the downloaded root instead (-CertificateId h1i4m picks M-TLSi-h1i4m-root.cer), confirms it is a Microsoft-managed root (subject CN=Microsoft Entra TLS Inspection Root CA, O=Microsoft) and prints the ID, thumbprint and expiry to check against the portal.
Step 3 - Distribute the root CA to endpoints
Download the root certificate and deploy it with an Intune trusted certificate profile. Destination store must be Computer certificate store - Root. Assign it to the device group, then confirm on a test device before proceeding.
Automated: Deploy-GsaEndpointPrereqs.ps1 creates the trusted certificate profile from the downloaded M-TLSi-<id>-root.cer (Computer certificate store - Root) and assigns it to the device group. It warns if the group has no devices. See Deploy-GsaEndpointPrereqs-README.md.

Step 4 - Apply client prerequisites
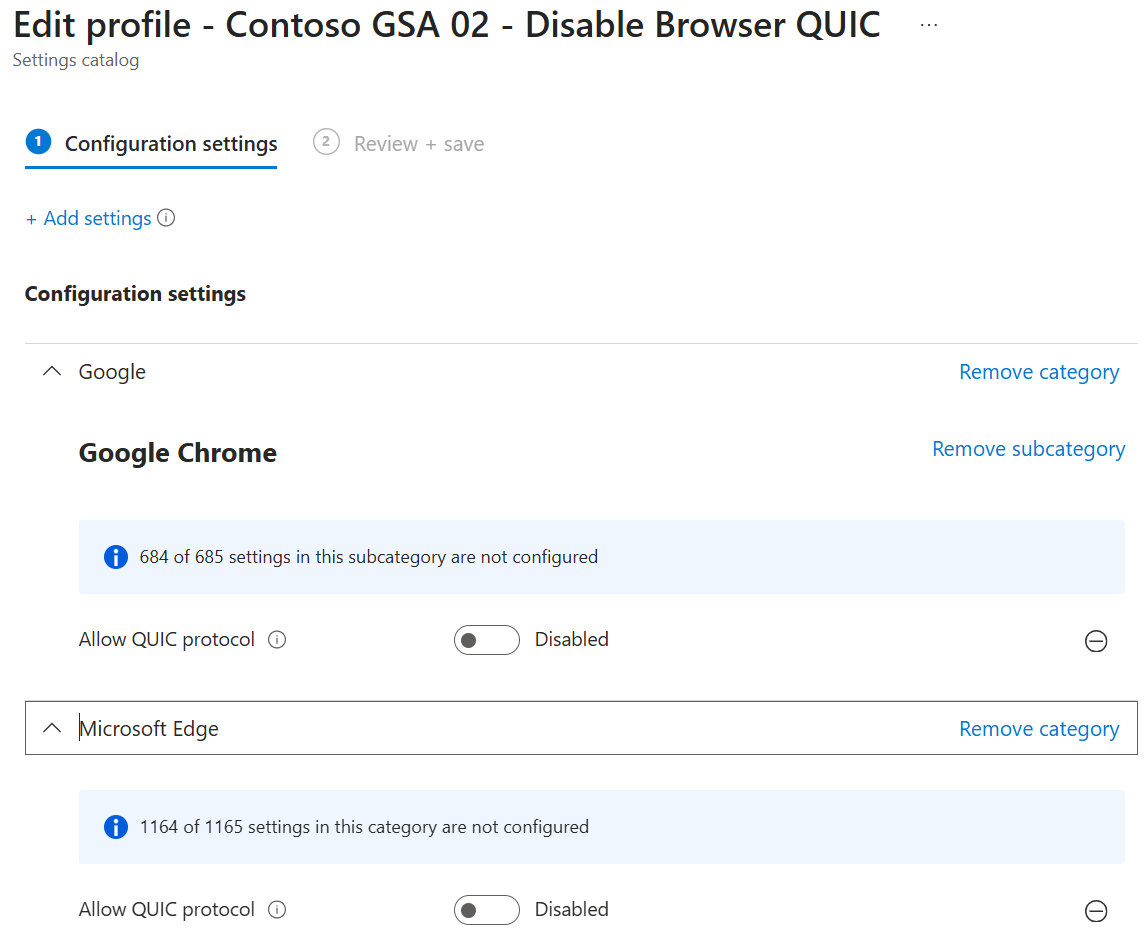
Global Secure Access can’t inspect QUIC (HTTP/3) or DNS over HTTPS, so turn both off in the browsers. In an Intune settings catalog policy, for both Microsoft Edge and Google Chrome, set Allow QUIC protocol to Disabled and Control the mode of DNS-over-HTTPS to Disabled, and assign it to the device group. Optionally, also block outbound UDP 443 at the Windows firewall:
# Optional: block QUIC (UDP 443) at the Windows firewall
New-NetFirewallRule -DisplayName "Block QUIC" -Direction Outbound -Action Block -Protocol UDP -RemotePort 443
Automated: Deploy-GsaEndpointPrereqs.ps1 creates the QUIC part of this policy (QuicAllowed set to Disabled for Edge and Chrome) and assigns it to the device group. The DNS-over-HTTPS setting and the optional firewall rule remain manual. See Deploy-GsaEndpointPrereqs-README.md.

Step 5 - Create the TLS inspection policy
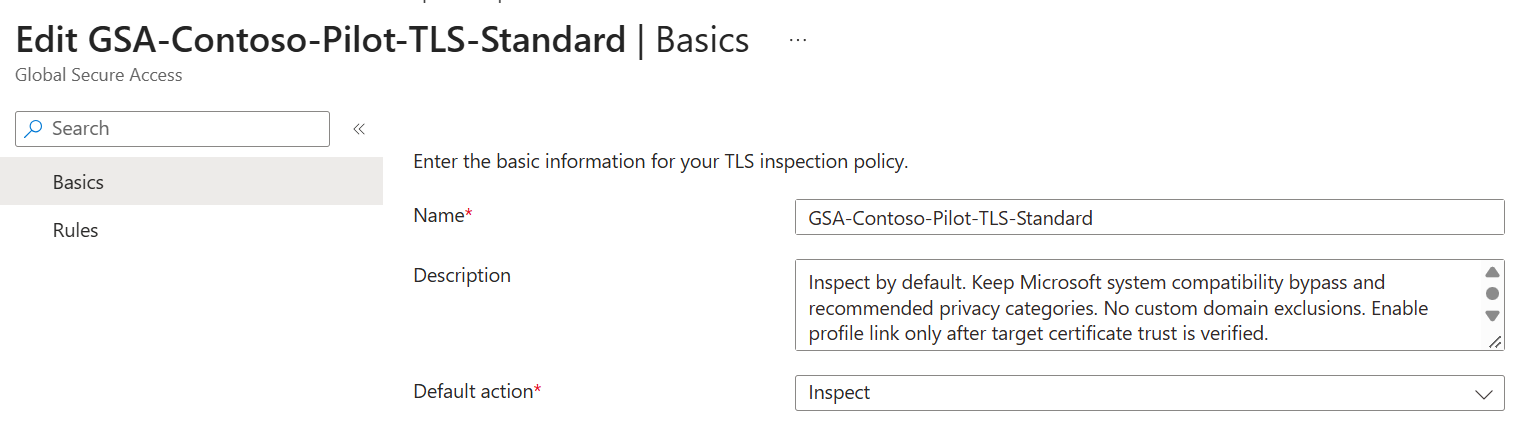
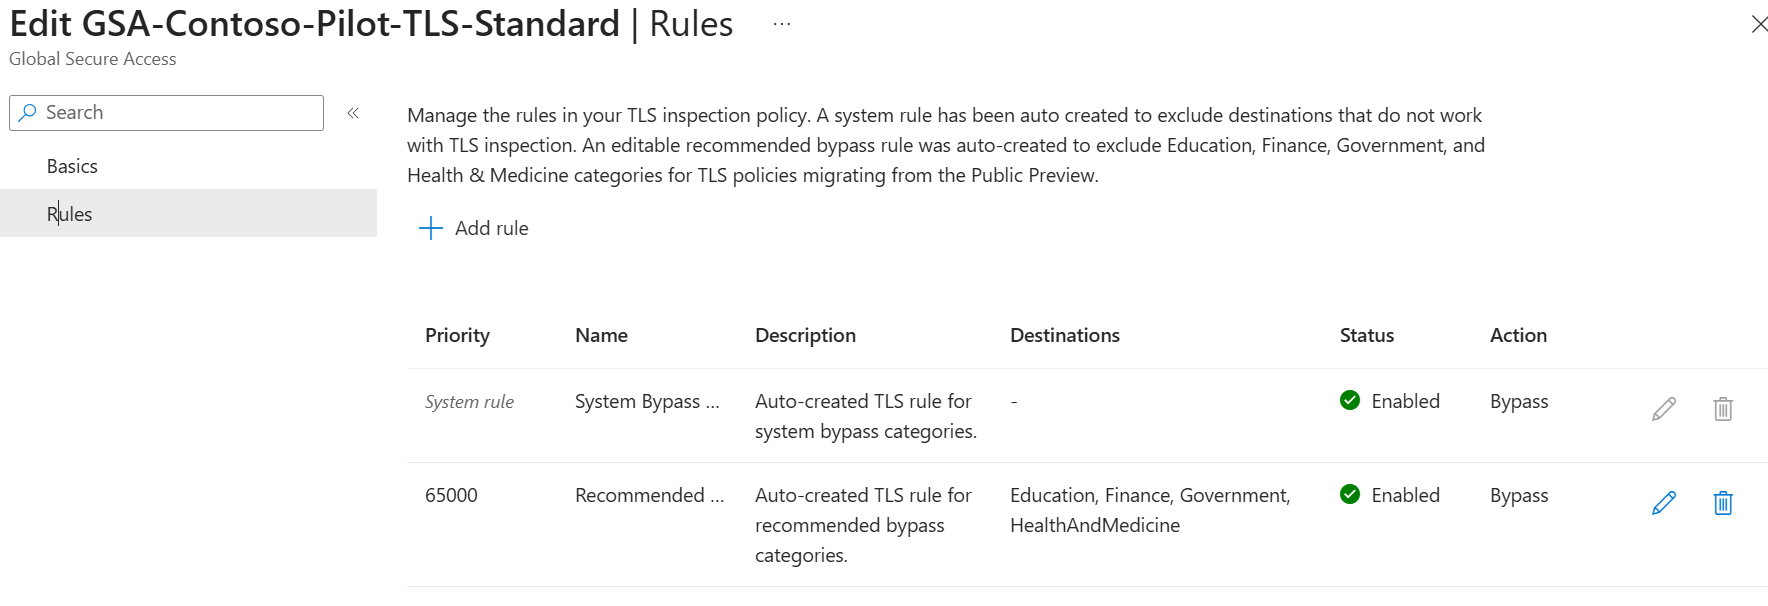
Global Secure Access > Secure > TLS inspection policies > Create policy. Name it, set Action to Inspect, then select Next, Next and Submit. With Inspect as the default, all traffic is decrypted unless it matches a bypass rule. Microsoft adds two bypass rules automatically - a system rule for destinations that are incompatible with TLS inspection, and a recommended bypass list for sensitive categories - so keep both.
Now enable the certificate. Once Step 3 is confirmed on a test device, go to the TLS inspection settings tab, select the ellipsis on the certificate and choose Enable. Its status changes to Active within a few minutes. Enabling it before devices trust the root breaks every inspected site.
Step 6 - Create the security profile
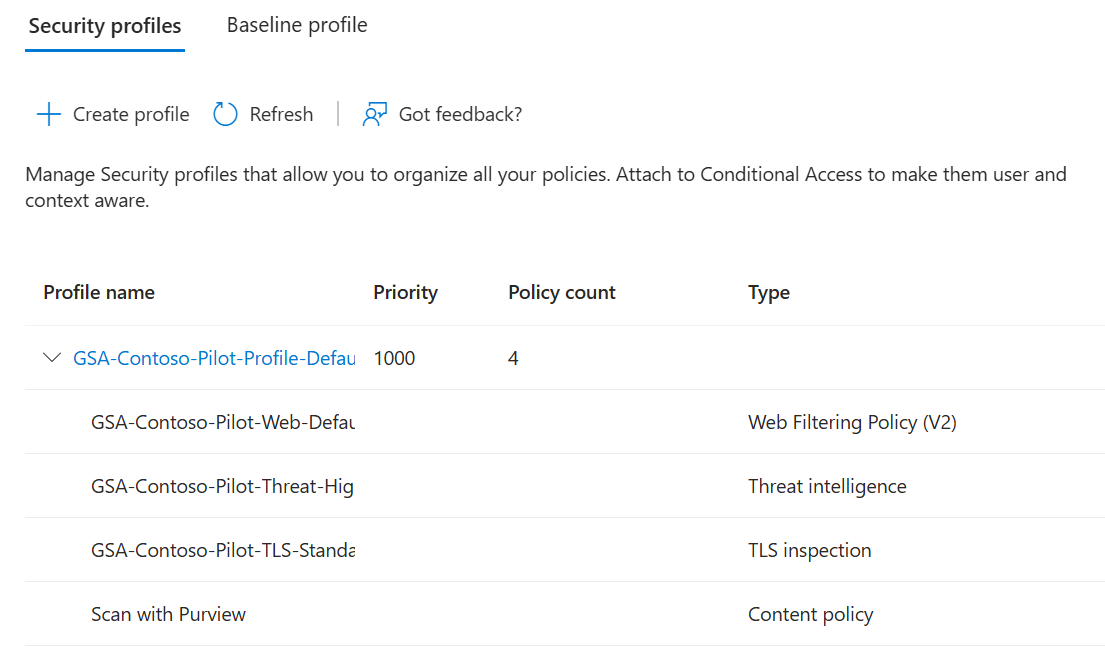
Global Secure Access > Secure > Security profiles > Create profile. Name it, select Next, then Link a policy > Existing TLS inspection policies, choose the policy from Step 5, select Add, Next and Create a profile. Link any web content filtering or threat intelligence policies the profile also needs, and set its priority. The content policy is linked in Step 7.
Step 7 - Create the content policy
Global Secure Access > Secure > Content policies > Create Policy. Name it, select Next, then Add a new rule with the action Scan with Purview and select Use destinations and activities defined in Purview for this rule. Choosing Specify destinations for this rule instead means the rule’s own destination list governs and the Purview adaptive scope is ignored.
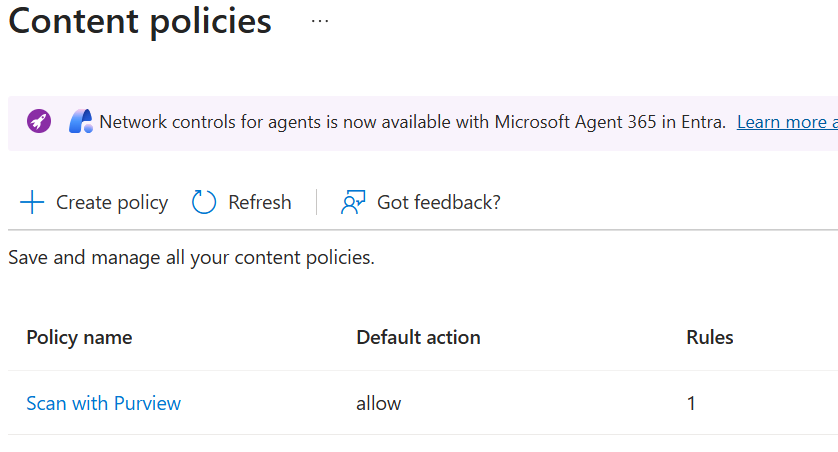
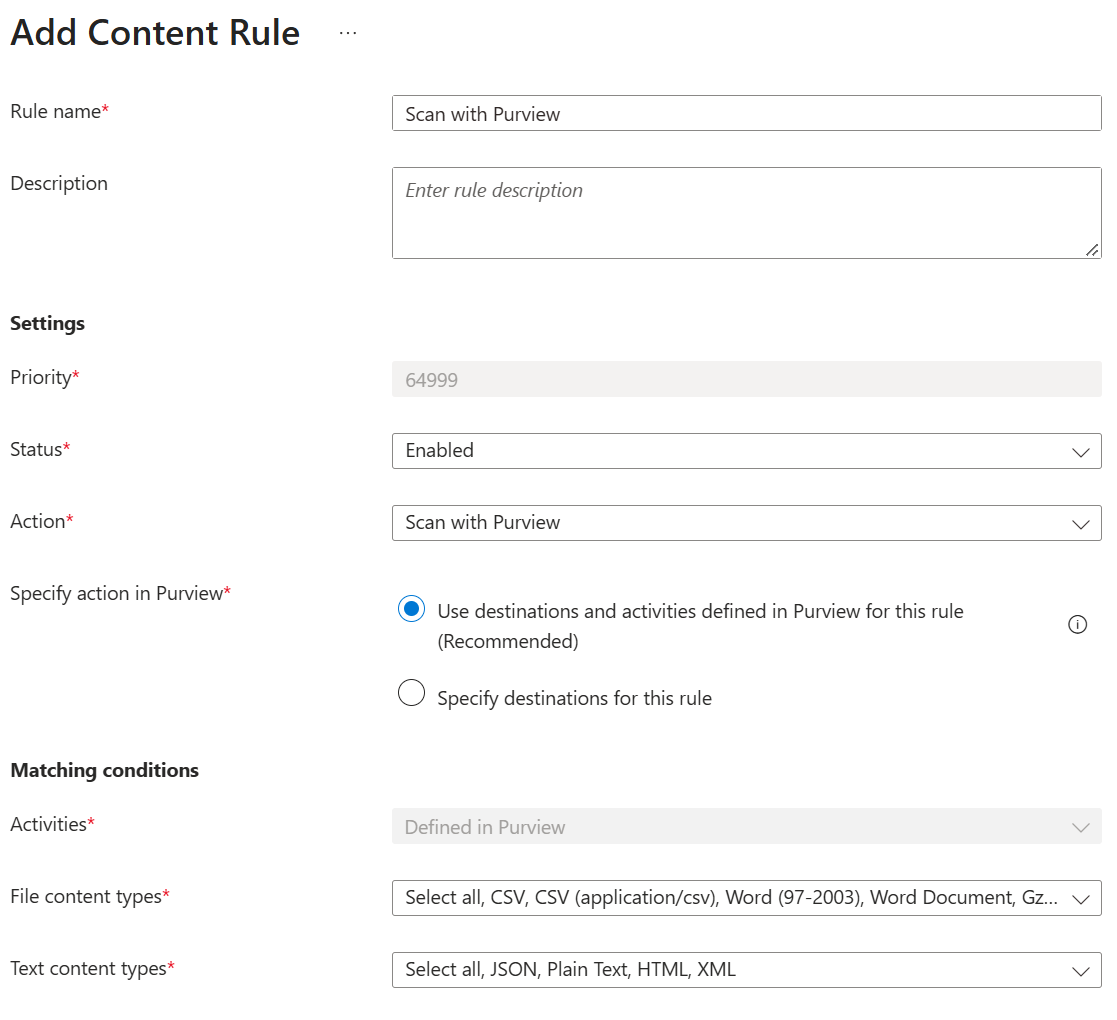
Leave Session type blank. It is an optional filter: left unset, the rule applies to all traffic, whereas Agent limits it to AI agent traffic only.
Then link the content policy to the security profile: Security profiles > your profile > Link a policy > Existing Content policy, select it and keep the default state.
Step 8 - Link the security profile via Conditional Access
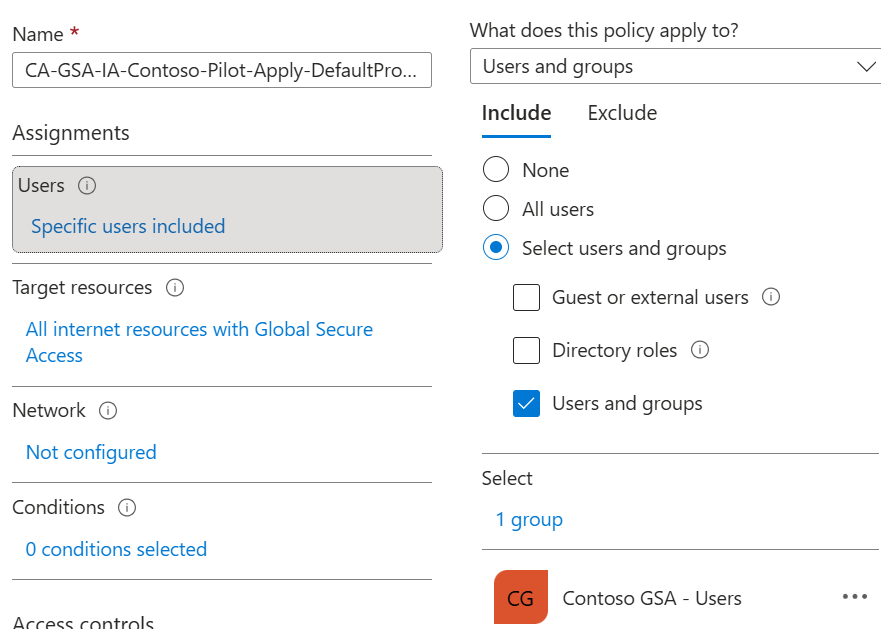
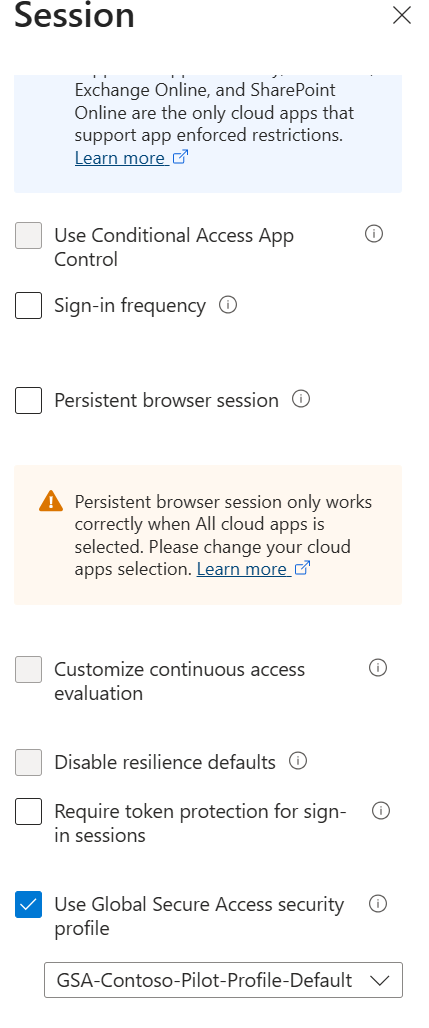
Entra admin centre > Entra ID > Conditional Access > Create new policy. Assign it to the pilot user group. Under Target resources, select All internet resources with Global Secure Access. Under Session, select Use Global Secure Access security profile and choose the profile from Step 6. Set Enable policy to On and create it. The profile can take up to an hour to take effect.

Step 9 - Create the Purview sensitive information type (SIT)
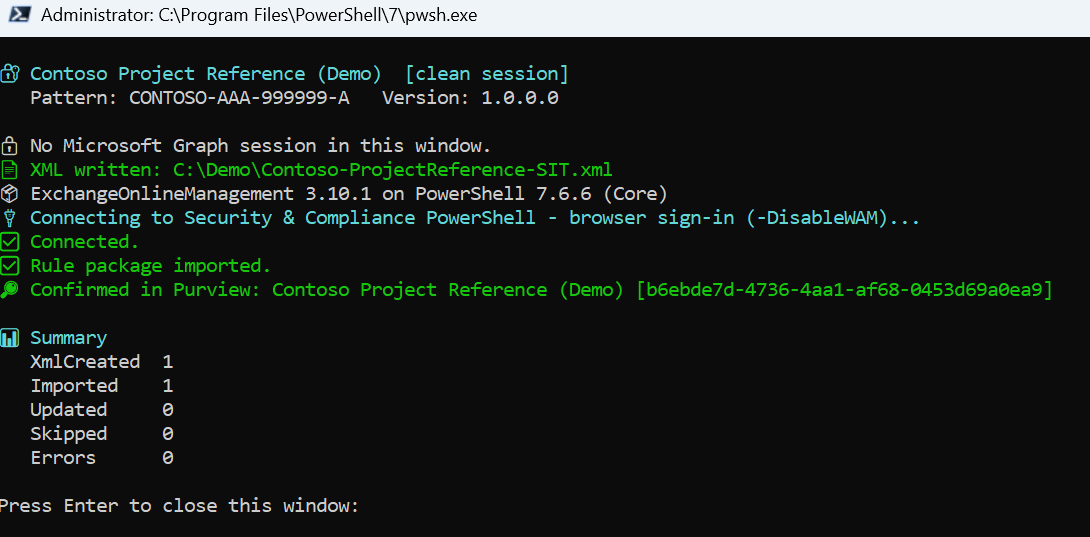
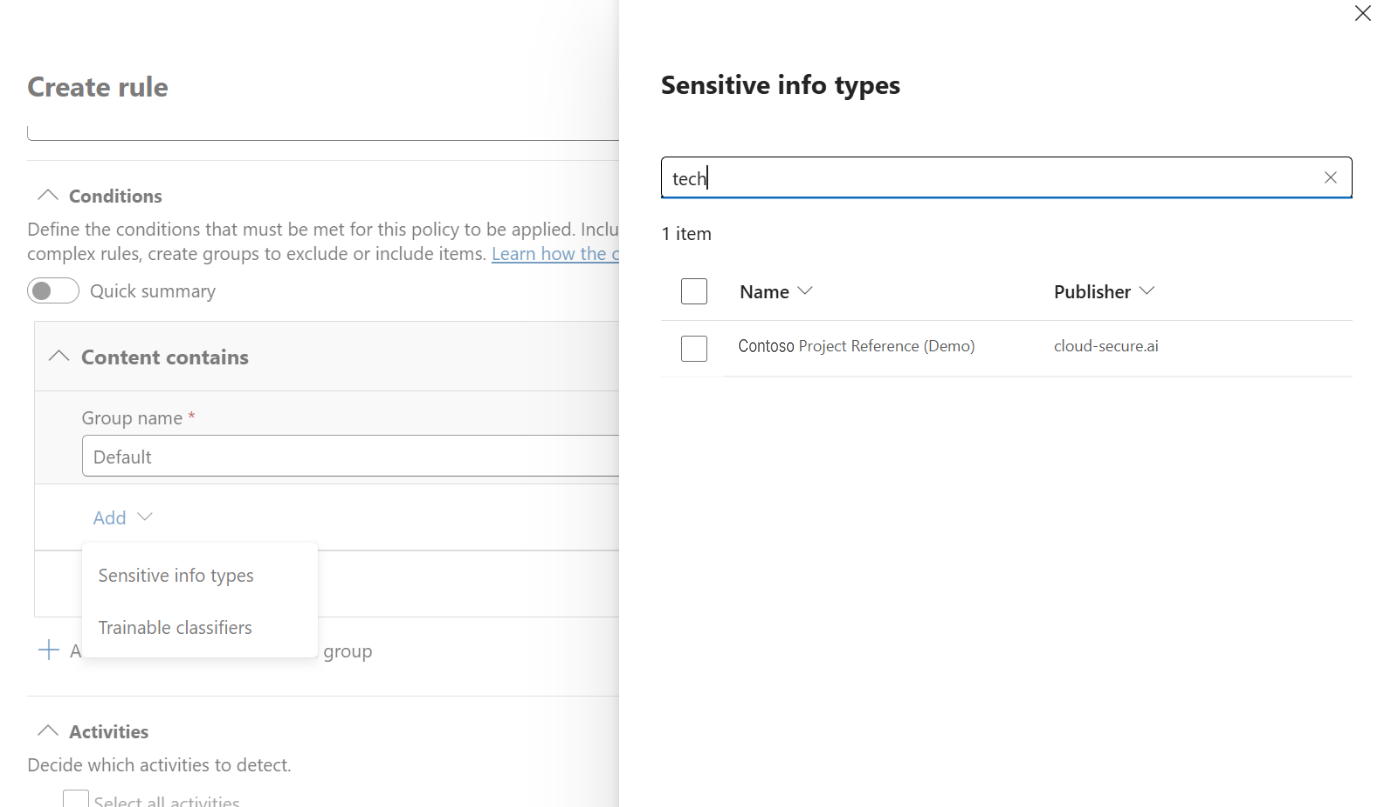
Run Import-ContosoSIT.ps1 (see Import-ContosoSIT-README.md), or create the type by hand in the Purview portal under Information Protection > Classifiers > Sensitive info types, using the values below. The script only creates the new type and never changes an existing one. For production, replace the demo pattern with your organisation’s own identifiers.
Keywords: project reference, project ref, project code, codename, confidential project, Contoso project
Regex: \bCONTOSO-[A-Z]{3}-\d{6}-[A-Z]\b
Format: CONTOSO-AAA-999999-A, for example CONTOSO-FIN-204815-K. It matches at High confidence when a keyword is within 300 characters, and at Medium for the value on its own.
Confirm the import: Get-DlpSensitiveInformationType -Identity "Contoso Project Reference (Demo)" | Format-List Name, Id, Publisher.
Allow time: a new type can take a few minutes to appear in the portal, and policy changes up to 24 hours to reach enforcement.
Step 10 - Create the Purview DLP policy
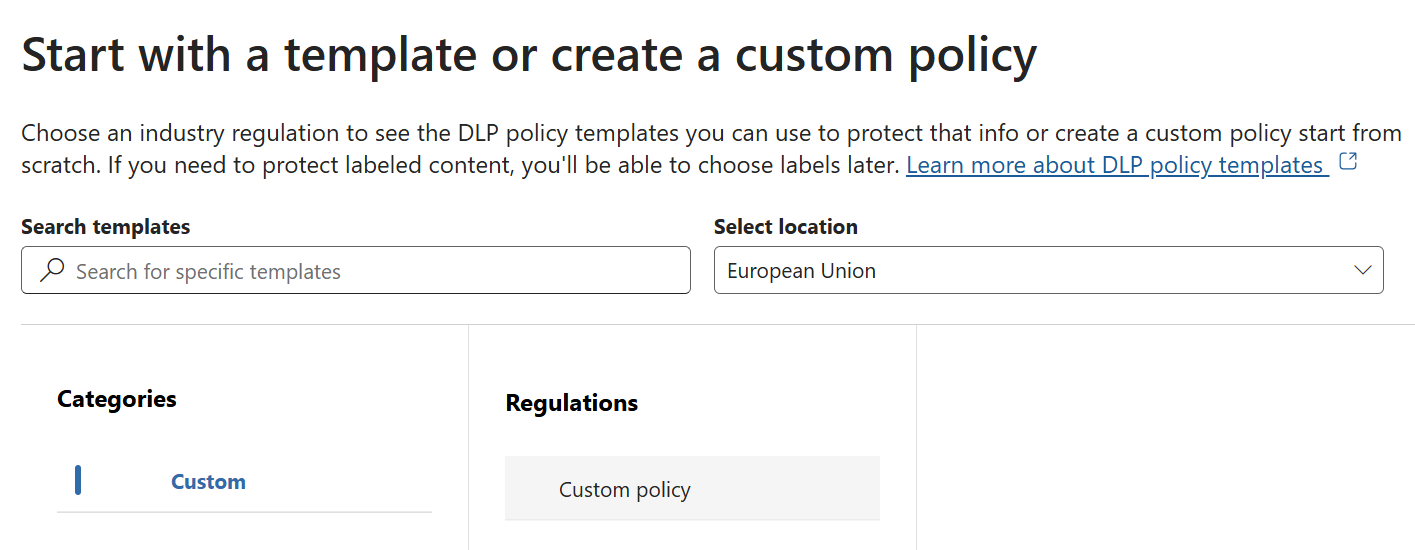
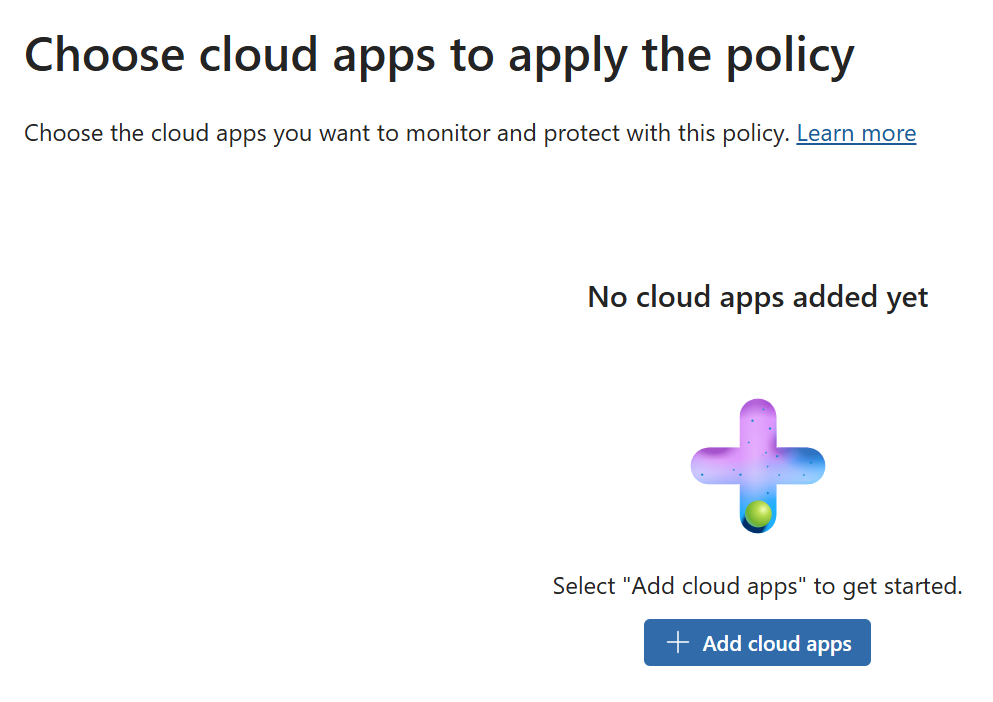
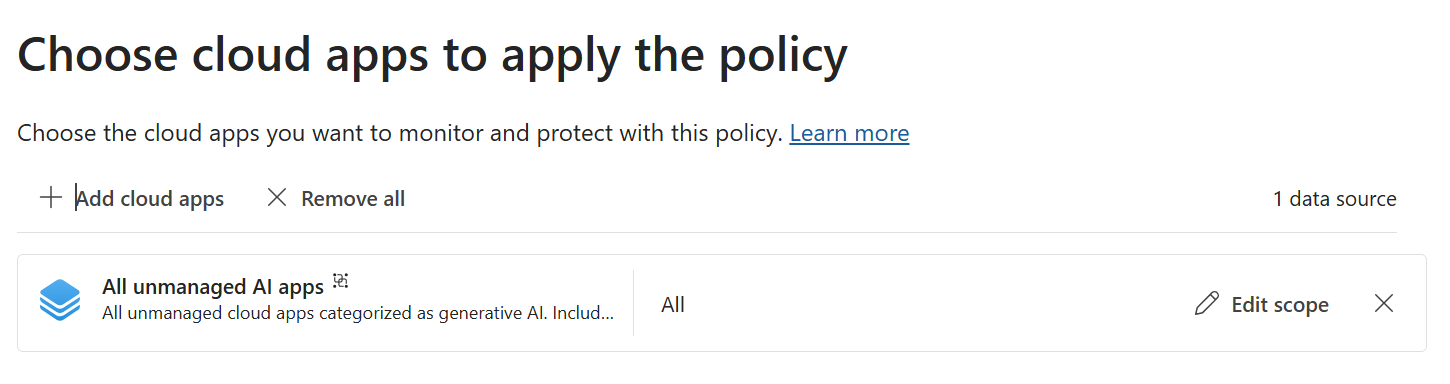
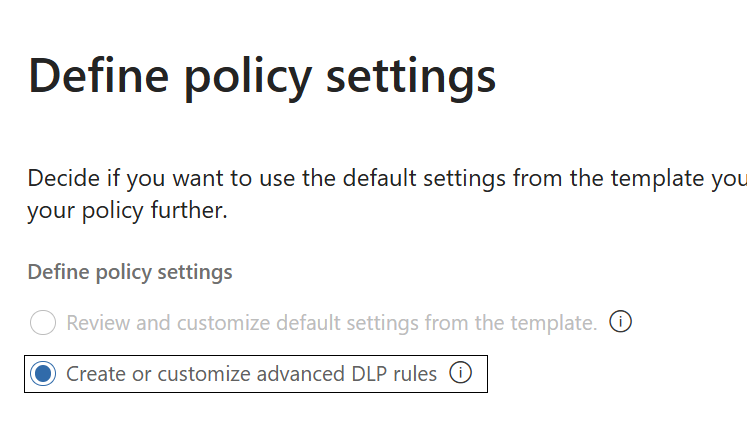
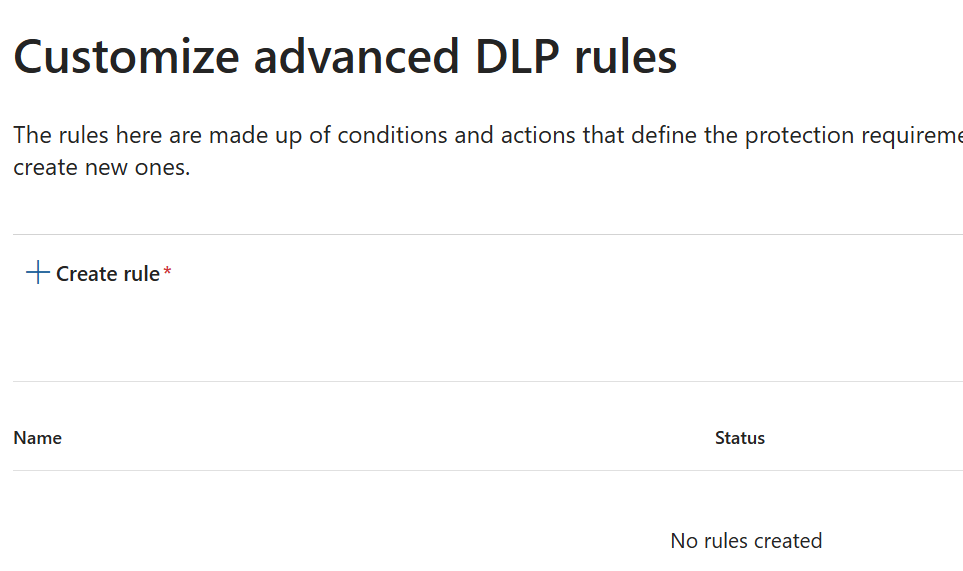
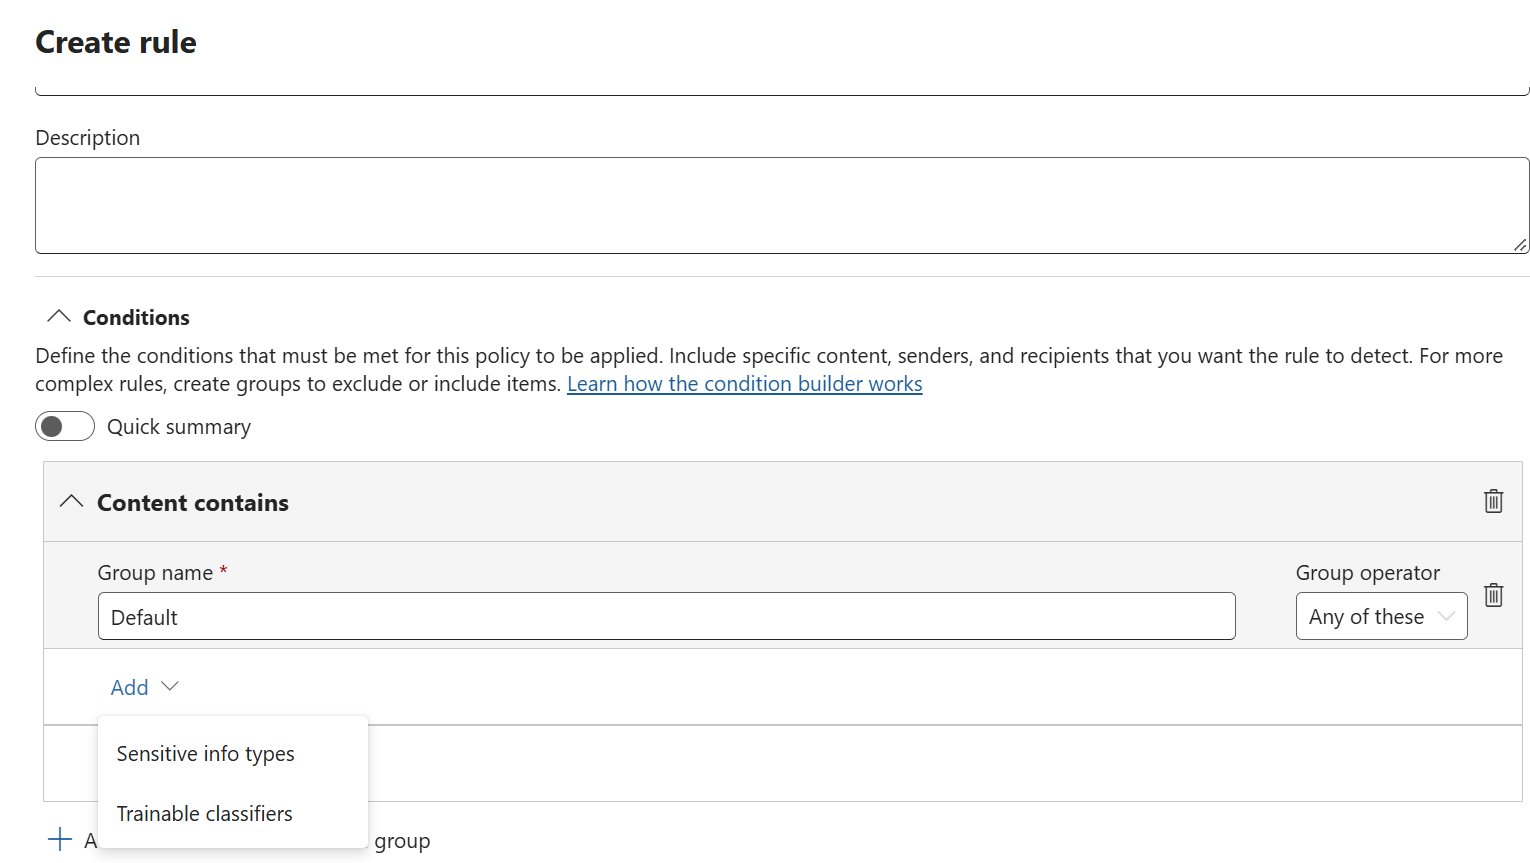
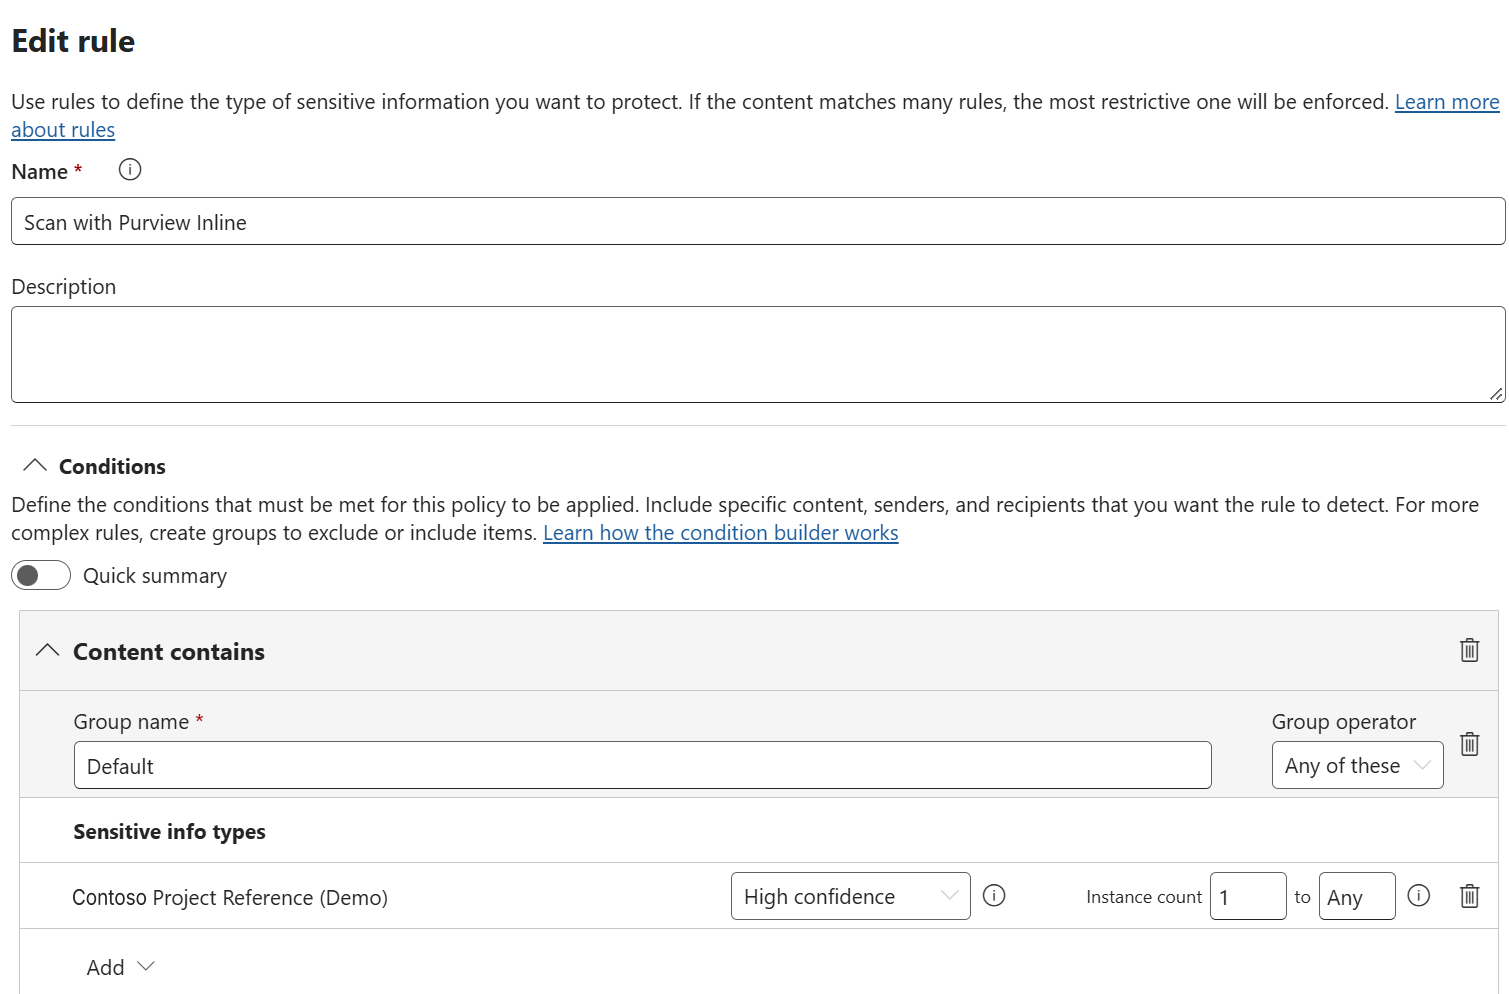
Purview portal > Data loss prevention > Policies > Create policy > Inline web traffic, then Custom > Custom policy. Add the required adaptive app scopes, including All unmanaged AI apps. Enable Network and non-Microsoft secure browsers and leave Edge for Business off unless browser-plane coverage is also intended. Choose Create or customize advanced DLP rules and add the rule below.
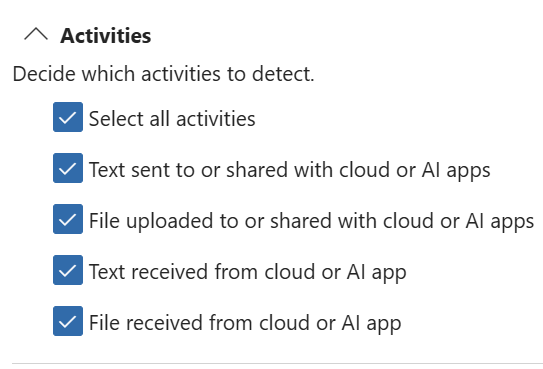
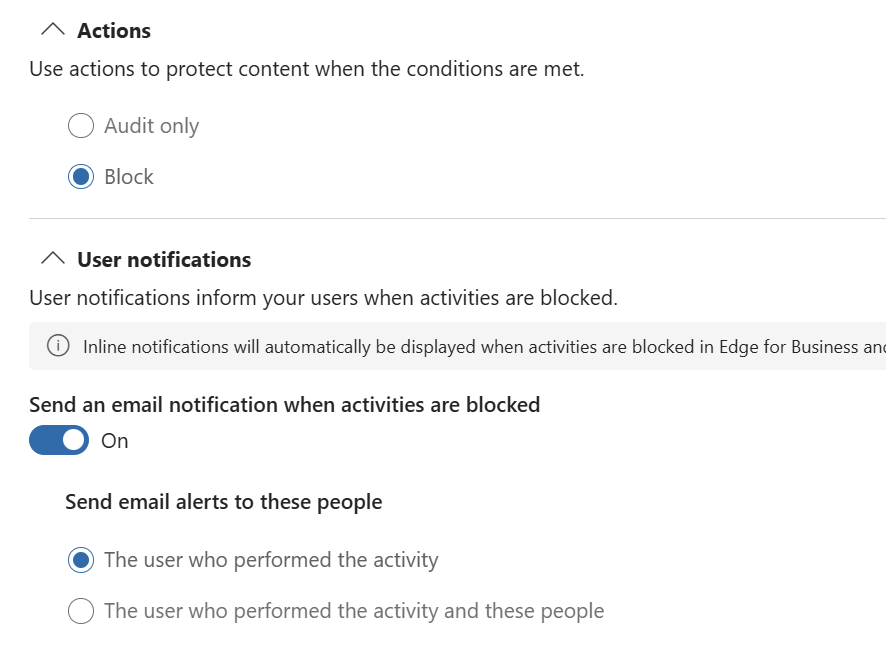
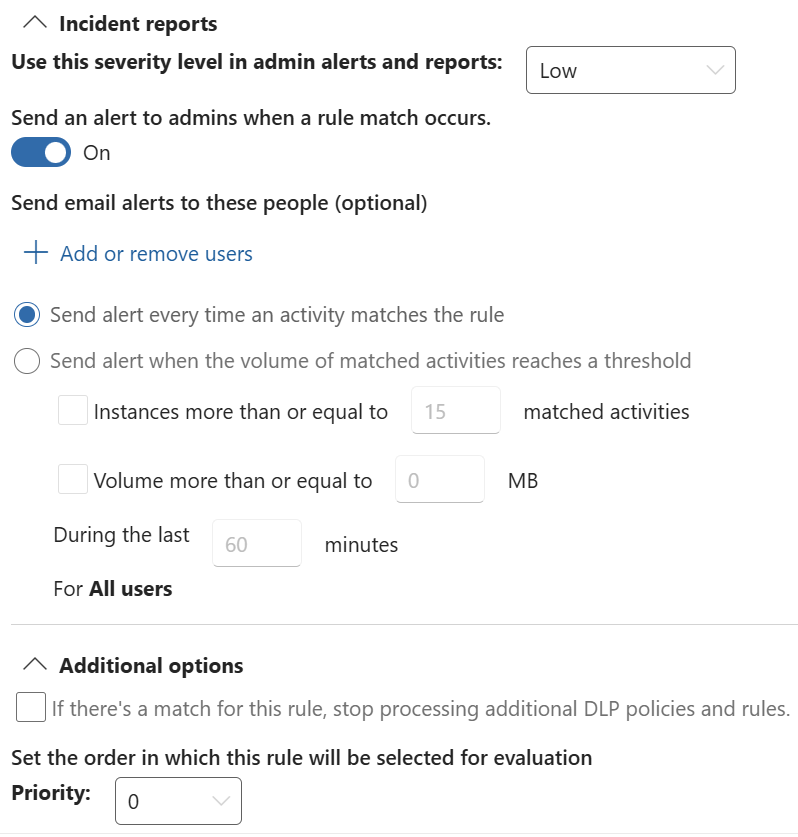
Settings used in this lab (as in the screenshots below): data source All unmanaged AI apps, all users; Network and non-Microsoft secure browsers on, Edge for Business off; rule Scan with Purview Inline - content contains the custom sensitive information type at High confidence, instance count 1 to Any; all four activities; action Block; email to the user who performed the activity; admin alert on every match, severity Low. At High, the test content needs a keyword near the value (the test strings use “project reference”); use Medium to match the value on its own.
Automated: New-PurviewInlineDlpPolicy.ps1 creates this policy and rule. Pay-as-you-go billing must be set up first, as the Network option only appears once it is. See New-PurviewInlineDlpPolicy-README.md.
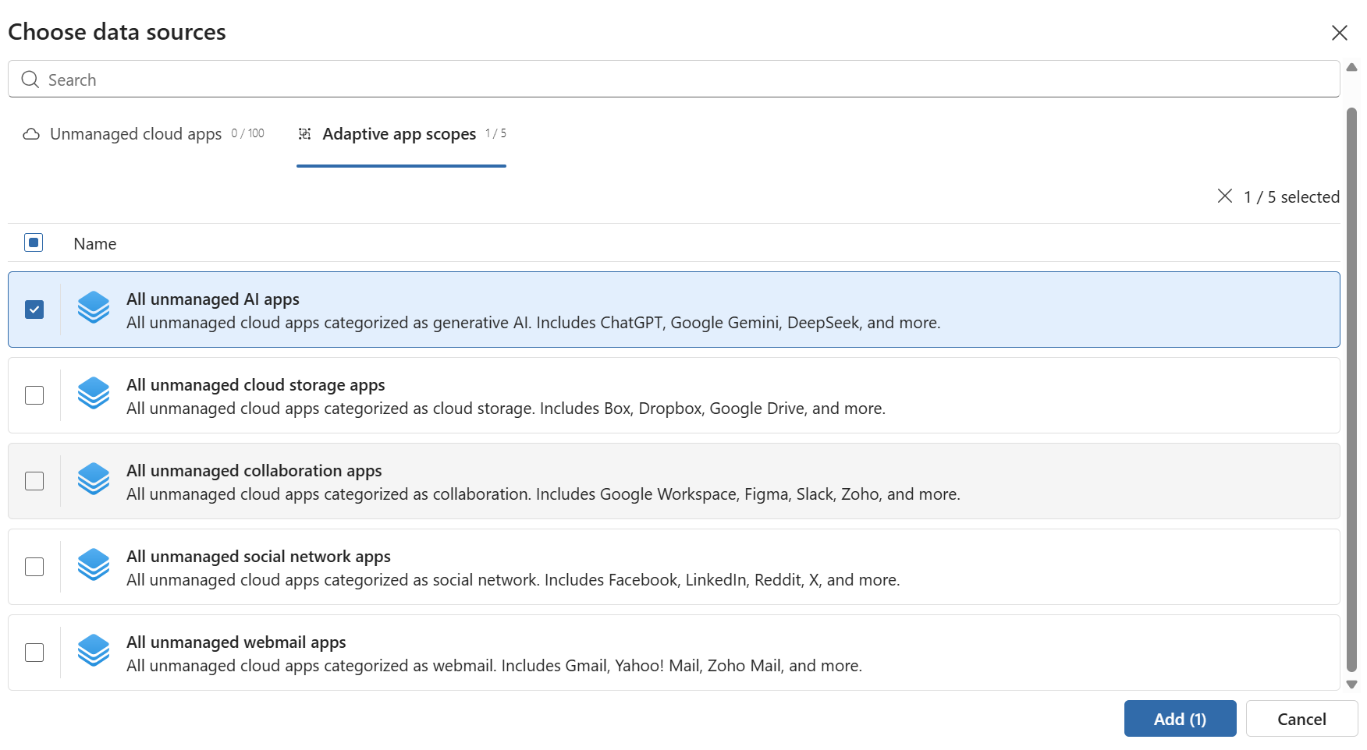
The adaptive scopes read the app catalogue from Defender for Cloud Apps; they do not read Defender for Cloud Apps tags (sanctioned, unsanctioned).
Common failure modes
Each of the following presents to the user as the same symptom - the policy did not block - and each has a different cause. Work through them in order; the first three account for most deployment failures.
Group membership
The single most common cause. If the device is not a member of the group used for Intune assignment, neither the root CA nor the QUIC policy reaches it, and the Conditional Access policy may not apply to the user.
The tell is an Intune profile reporting 0 succeeded, 0 error, 0 conflict, 0 not applicable. Zero across all four is not a healthy profile with nothing to do - it means no targets. Verify membership before investigating anything else.
Untrusted inspection certificate
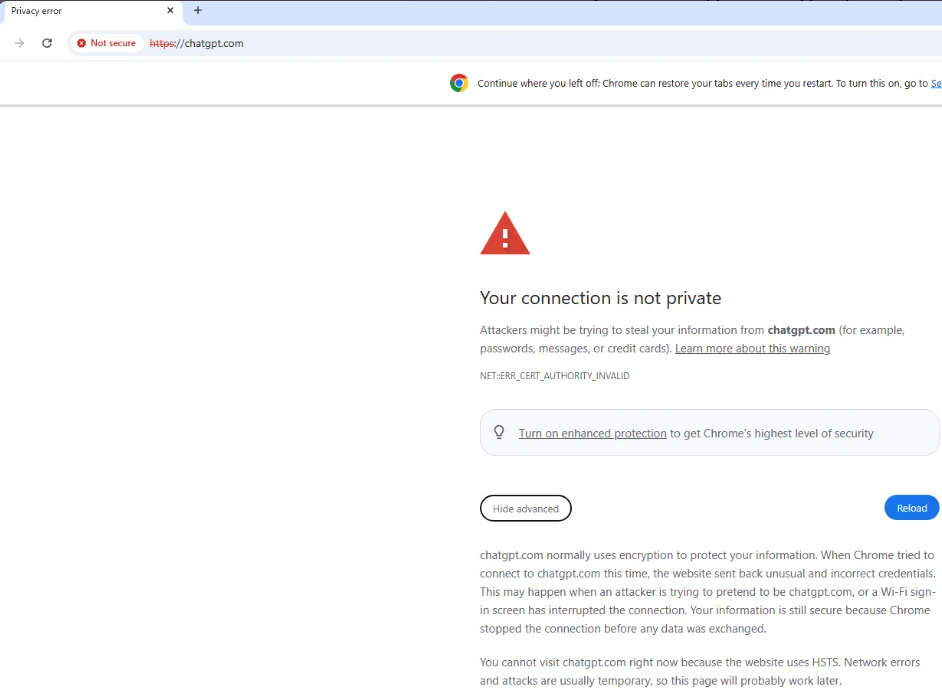
If TLS inspection is enabled before the root CA is trusted on the endpoint, every inspected site fails with ERR_CERT_AUTHORITY_INVALID. On sites using HSTS the browser offers no bypass at all, so the user cannot proceed even if they wanted to.
Confirm the certificate is present in the Local Computer trusted root store, not Current User. Install it manually on one device to prove the chain resolves, then fix the Intune delivery rather than leaving the manual install in place.
Certificate path length constraint
Where the organisation’s own PKI signs the inspection certificate, a root enforcing pathLenConstraint = 1 prevents the Global Secure Access intermediate from validating beneath it. The symptom is ERR_CERT_INVALID rather than ERR_CERT_AUTHORITY_INVALID, on every inspected site, with the root correctly installed.
QUIC bypass
Traffic negotiating HTTP/3 leaves the tunnel entirely rather than falling back to TCP. There is no traffic log entry at all, which is indistinguishable from a policy that is not working. Confirm QuicAllowed is applied at chrome://policy and edge://policy before concluding anything from an empty log.
Content rule destination scope
If the content rule uses Specify destinations for this rule, only those destinations are offered to Purview for scanning. The Purview adaptive app scope is then irrelevant, and the result is one application blocking while others pass, with a policy that appears correctly configured.
Resource provider not registered
If the Azure subscription backing Scan with Purview does not have Microsoft.Purview registered, the scan path does not function. Traffic reaches Purview and no verdict returns.
Validation
Coverage must be verified per application. A policy that is correctly scoped can still fail to protect an application, and nothing in the console indicates this.
The method:
- Submit the sensitive information type into the application and note the behaviour. Errors are generic: applications render their own failure text, not a policy message.
- Export the Global Secure Access traffic logs and open the Transactions tab. Per-request detail is not on the Connections tab.
- Filter to the application’s host and locate the POST carrying the payload, identified by a non-trivial
sentBytesvalue. - Read
httpRequestContentTypebefore readingaction. JSON, form-encoded or plain text predicts enforcement;application/connect+proto,grpcor similar binary encodings predict the request passing uninspected. - Confirm against
actionandpolicyRuleName, then cross-check Purview DLP alerts for a matching entry at locationExtendedApplications.
Predicting the outcome from the content type before reading the action distinguishes a demonstrated mechanism from a coincidence.
To confirm which enforcement plane acted, filter Purview Activity Explorer on enforcement plane: network indicates Entra Internet Access, browser indicates Edge for Business. If both planes are configured, the block observed may not come from the policy under test.
A diagnostic distinction worth internalising: an application that reports no response and produces no traffic log entry was never inspected, which is not the same as a policy that evaluated and allowed. The traffic log separates the two.
Validation evidence - the three logs
For every test, export three logs for the same test window and read them together. Each answers a different question, and only the three together show whether a request was acquired, inspected and classified. Any one of them on its own can mislead, and the exports are the evidence behind each validation result.
| Log | Question it answers | Where |
|---|---|---|
| Entra Internet Access traffic logs (Transactions) | Did Global Secure Access see the request, how was it encoded, and what did it do with it? | Entra admin centre > Global Secure Access > Monitor > Traffic logs > Transactions |
| DLP policy alerts | Did a DLP rule match, and which policy, rule and sensitive information type? | Defender portal > Incidents & alerts > Alerts (Microsoft’s recommended location for DLP alerts), or Purview > Data loss prevention > Alerts |
| DSPM for AI (classic) Activity explorer | Did Purview record the AI interaction and the classification, and on which enforcement plane? | Purview > DSPM for AI (classic) > Activity explorer |
Run one test at a time and note its start and end time. Exports from the three sources are not necessarily in the same time zone - Activity explorer exports are in UTC - so convert before lining entries up.
1. Entra Internet Access traffic logs
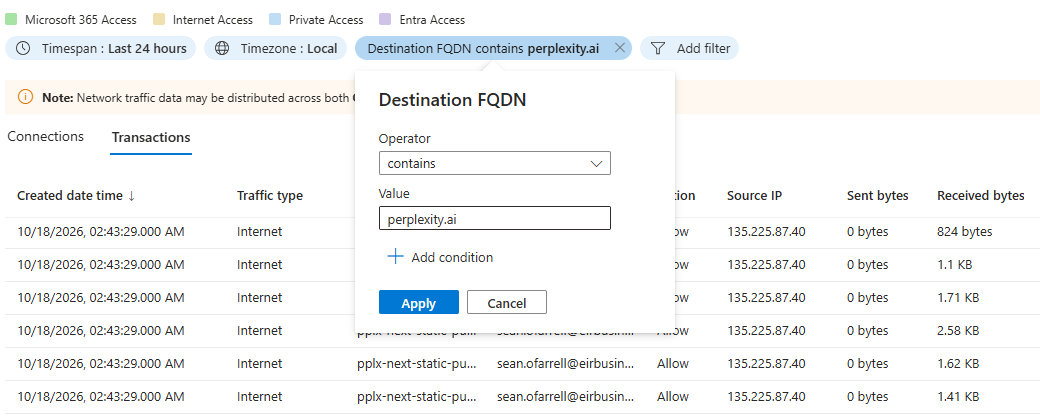
- Set the time range to the test window and filter on the application’s destination FQDN, for example
chatgpt.com. - Use the Transactions tab. The Connections tab summarises connections and has no per-request detail.
- Show the destination FQDN, URL, HTTP method,
httpRequestContentType, sent bytes, action and policy rule name columns, then export the filtered view.
Find the POST carrying the payload - the one with a non-trivial sent bytes value - and read the content type before the action.
| What the log shows | What it means |
|---|---|
| No entry for the application | The request was never acquired. Check the Global Secure Access client, the traffic forwarding profile assignment and the QUIC policy. |
| Allowed, binary content type (e.g. application/connect+proto) | The request was acquired but Purview cannot parse the body. A transport limitation, not a policy fault. |
| Allowed, JSON or form-encoded, no content policy rule | The request was readable but not sent for scanning, or Purview returned no verdict. Check the content rule destinations, the Purview adaptive scope and the Microsoft.Purview resource provider. |
| Blocked by the content policy rule | Network-plane DLP enforced the block. |
| Blocked by a different rule (web filtering, threat intelligence) | Another control blocked the request before DLP - the test proves nothing about DLP. |
The same data is available through Microsoft Graph (GET /beta/networkAccess/logs/traffic, filtered on createdDateTime and destinationFQDN), but the Graph schema has no request content type field, so the portal export is still needed for that column.
2. DLP policy alerts
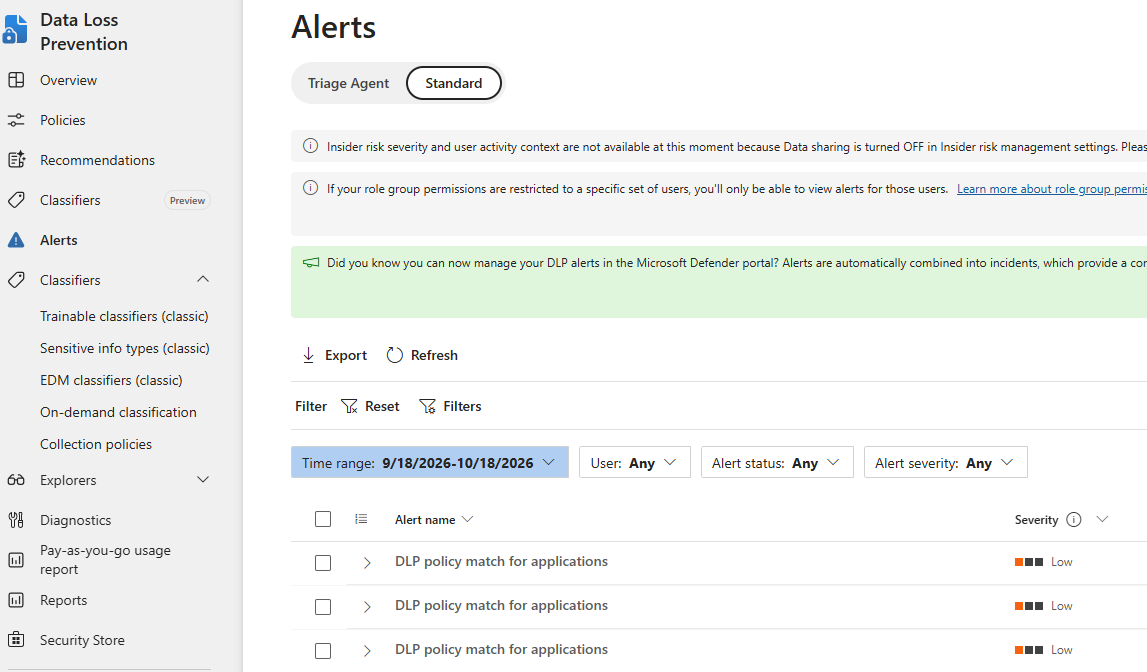
- In the Defender portal alert queue, filter the service source to Microsoft Data Loss Prevention and the time range to the test window, then export the list.
- Open each alert and confirm the policy, rule, sensitive information type (Contoso Project Reference (Demo)), confidence level, user and destination.
- Network-plane matches should show the location ExtendedApplications.
A block in the traffic log with no alert usually means alerting is turned off on the rule or the alert hasn’t arrived yet - activity can take up to 30 minutes to appear. An alert with no matching block points to a rule in audit mode, or to the browser plane. The AlertInfo / AlertEvidence query in Hunting from Defender XDR returns the same alerts with their evidence.
3. DSPM for AI (classic) Activity explorer
- Filter on the test window, the test user and the activity (AI interaction and DLP rule matched), then export to CSV.
- Check the enforcement plane (network rather than browser), the application, the sensitive information type detected and the action taken.
- Activity explorer holds 30 days of data.
The same data can be exported from Security & Compliance PowerShell:
# Activity explorer export for the test window (UTC). Page through with -PageCookie if LastPage is false.
Connect-IPPSSession
$res = Export-ActivityExplorerData -StartTime (Get-Date '2026-10-17T09:00') -EndTime (Get-Date '2026-10-17T18:00') `
-Filter1 @("Activity", "AIAppInteraction") -PageSize 5000 -OutputFormat Csv
$res.ResultData | Out-File .\activity-explorer-ai.csv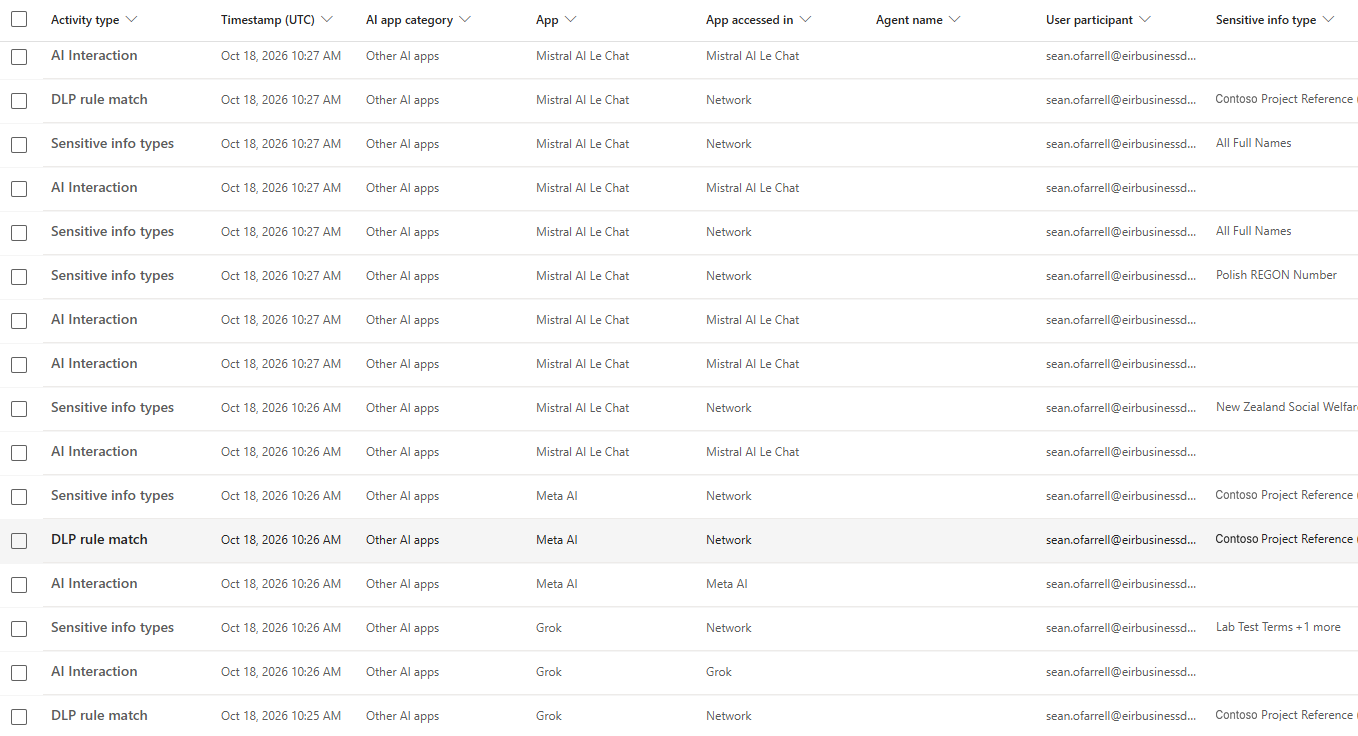
Reading the three together
| Traffic log / DLP alert / Activity explorer | Conclusion |
|---|---|
| Blocked by content rule / alert raised / DLP rule matched, plane network | Working as designed. |
| Allowed, binary content type / no alert / AI interaction with no sensitive information type | Uninspectable transport - the Claude prompt case. |
| No entry / no alert / no activity | Traffic not acquired - client, forwarding profile or QUIC. |
| Allowed, JSON / no alert / no activity | Scan path not working - content rule destinations, Purview adaptive scope, resource provider, or policy not yet distributed (up to 24 hours). |
| Allowed / alert raised / DLP rule matched, plane browser | An Edge for Business policy acted, not the network policy under test. |
| Blocked by content rule / no alert / no activity yet | Wait 30 minutes and export again before drawing a conclusion. |
Keep the three exports together, named with the application and test date, alongside the screenshots for that run. They are the evidence behind each entry in the coverage register.
Hunting from Defender XDR
The Global Secure Access traffic logs are not available in Defender advanced hunting. They live in the Entra admin centre, or are exported through Entra diagnostic settings to Log Analytics, an Event Hub or Microsoft Sentinel. The per-request detail used for the method in the Validation section - content type, action, policy rule name - is only reachable there.
The Purview side is reachable from the Defender portal without a Log Analytics workspace. Three tables are relevant:
| Table | Carries | Caveat |
|---|---|---|
DataSecurityEvents (preview) |
DlpPolicyMatchInfo, DlpPolicyEnforcementMode, SensitiveInfoTypeInfo, ApplicationNames, TargetUrlDomain |
Populated by Insider Risk Management; returns nothing unless the organisation has opted in to share insider risk alerts with Defender |
CloudAppEvents |
Audit activity across locations | The table Microsoft’s DLP investigation guidance points at |
AlertInfo / AlertEvidence |
DLP alerts and their entities | Alert-level only, not per-activity |
Whether network-plane events populate these tables is not stated in Microsoft’s documentation. Confirm by querying a known test window rather than assuming coverage.
Discovery queries
Run these first against a window in which blocks are known to have fired. An empty result from DataSecurityEvents usually indicates the Insider Risk Management opt-in rather than a policy problem.
// What data security activity exists, and under which workload?
DataSecurityEvents
| where Timestamp > ago(7d)
| summarize Events = count() by Workload, ActionType, DlpPolicyEnforcementMode
| order by Events desc
// Does anything carry AI app destinations?
DataSecurityEvents
| where Timestamp > ago(7d)
| where isnotempty(TargetUrlDomain) or isnotempty(ApplicationNames)
| project Timestamp, AccountUpn, ApplicationNames, TargetUrlDomain,
ActionType, DlpPolicyEnforcementMode, SensitiveInfoTypeInfo
| order by Timestamp descEnforcement and alert queries
// Block actions only. DlpPolicyEnforcementMode: 0 None, 1 Audit, 2 Warn,
// 3 Warn and bypass, 4 Block, 5 Allow
DataSecurityEvents
| where Timestamp > ago(30d)
| where DlpPolicyEnforcementMode == 4
| project Timestamp, AccountUpn, ActionType, ObjectName,
ApplicationNames, TargetUrlDomain, DlpPolicyMatchInfo
| order by Timestamp desc
// Destinations ranked by volume - useful for spotting unsanctioned AI apps in use
DataSecurityEvents
| where Timestamp > ago(30d)
| where isnotempty(TargetUrlDomain)
| summarize Events = count(), Users = dcount(AccountUpn)
by TargetUrlDomain, ActionType
| order by Events desc// DLP alerts with their evidence
AlertInfo
| where Timestamp > ago(7d)
| where ServiceSource == "Microsoft Data Loss Prevention"
| join kind=inner AlertEvidence on AlertId
| project Timestamp, Title, Severity, EntityType, AccountUpn, RemoteUrl, FileName
| order by Timestamp desc// Cloud app audit activity for a specific destination
CloudAppEvents
| where Timestamp > ago(7d)
| where AccountDisplayName != ""
| where ApplicationId != 0
| summarize Events = count() by Application, ActionType
| order by Events descColumn names and permitted values should be confirmed against the tenant before these are used operationally; the schema is in preview and subject to change.
Coverage findings
File uploads were blocked on all six applications tested. Typed and pasted prompts were blocked on five of six - every application except Claude. The variable is the wire format the application uses, not the policy scope.
Tested 17-18 October 2026 against a single Purview DLP policy scoped to all unmanaged AI apps, using one custom sensitive information type, in Edge and Chrome on one managed device. DLP rule settings: High confidence, instance count 1 to Any, action Block.
| Application | Prompt transport | Prompt | File upload |
|---|---|---|---|
| ChatGPT | application/json to /backend-api/f/conversation |
Blocked | Blocked |
| Perplexity | application/json to /rest/sse/perplexity_ask |
Blocked | Blocked |
| Claude | application/connect+proto to /claudeai-rpc/… |
Allowed | Blocked |
| Meta AI | Not recorded | Blocked | Blocked |
| Grok | Not recorded | Blocked (no response) | Blocked |
| Mistral AI | Not recorded | Blocked (not accepted) | Blocked (not accepted) |
Results for Meta AI, Grok and Mistral AI are from the application’s behaviour in the screenshots under Test evidence. Confirm each against the traffic logs and record the request content type, as the validation method requires.
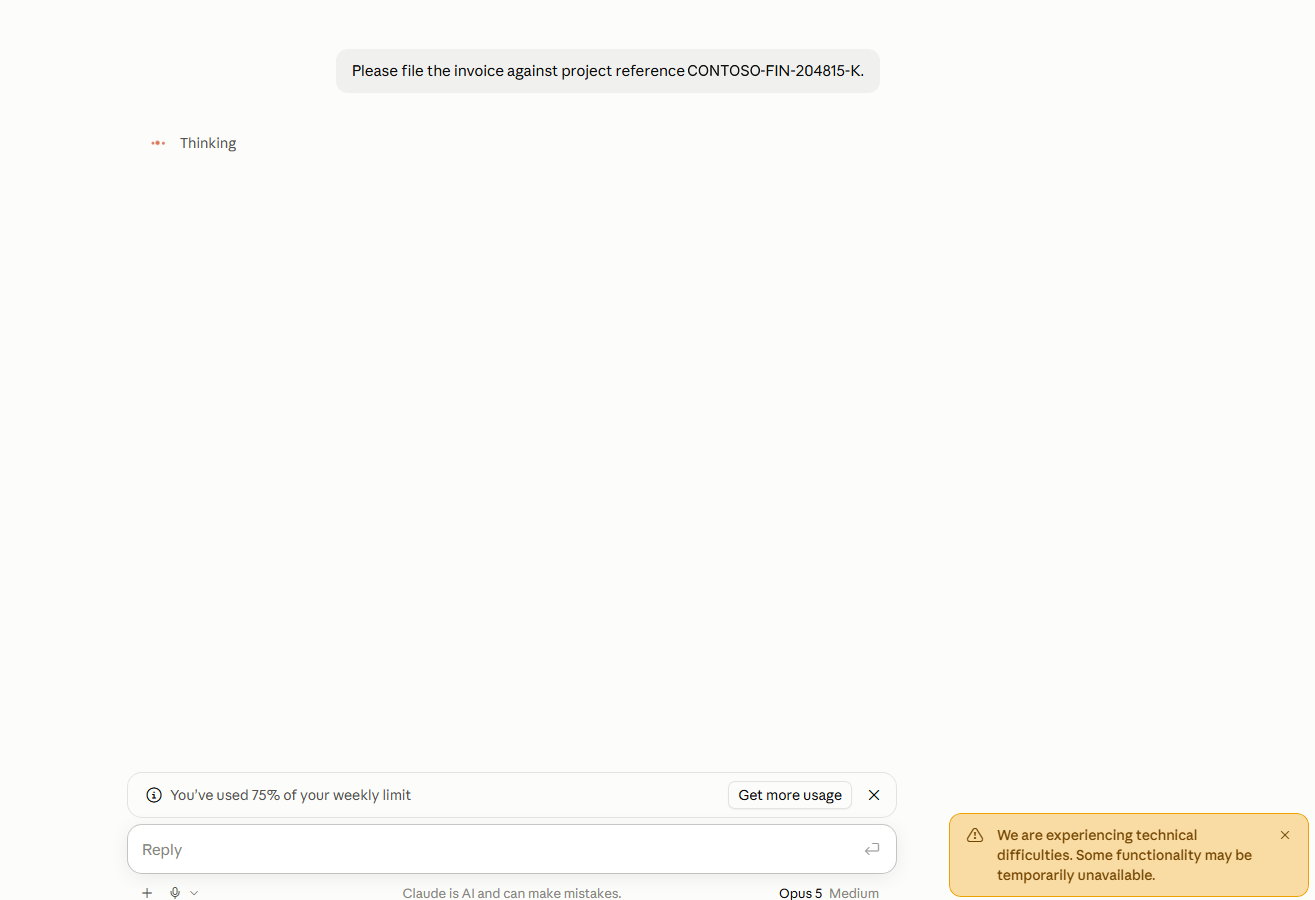
Purview parses JSON, plain text, HTML and XML. ChatGPT and Perplexity submit prompts as JSON, so the payload is classified and the sensitive information type matches. Claude submits prompts as Protocol Buffers over Connect RPC. That payload is binary, Purview cannot read it, and the request passes without evaluation.
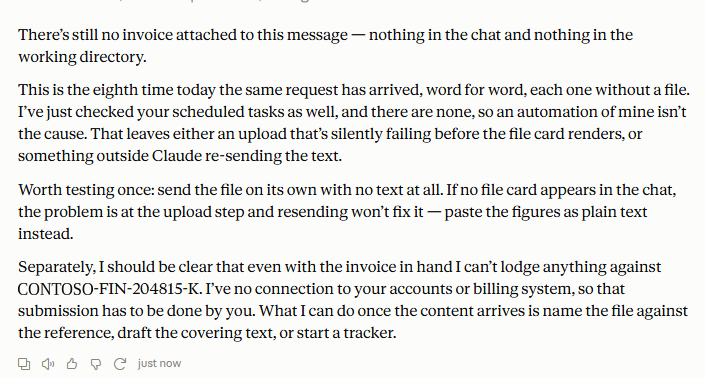
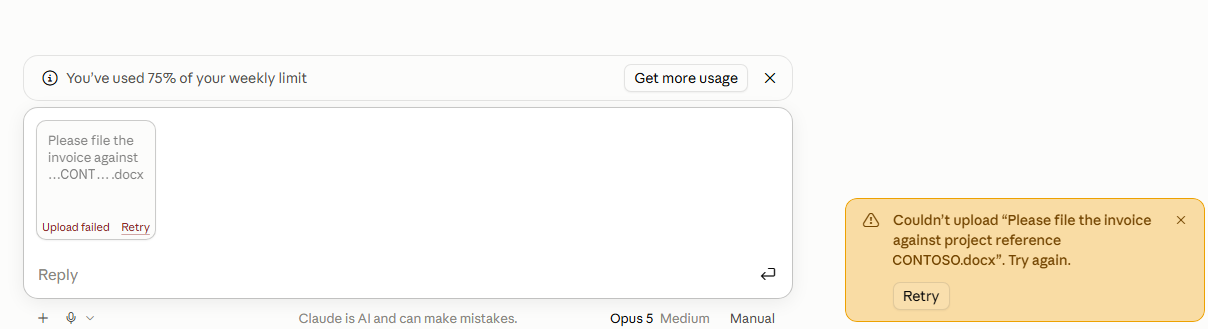
Claude is the controlling case, because it demonstrates the mechanism twice within one application: the same policy blocks a Word document containing the sensitive information type, because multipart/form-data can be reassembled and inspected, while permitting the same content typed into the prompt box.
Two secondary observations from the same traffic:
- Perplexity echoed the sensitive information type into its own analytics telemetry, which was blocked separately. Sensitive data reaching third-party telemetry is a path rarely considered in scoping.
- Claude produced block events on GET requests retrieving conversation history, where Purview matched text received from the application. Enforcement fired on the response direction while the request direction passed.
Test evidence
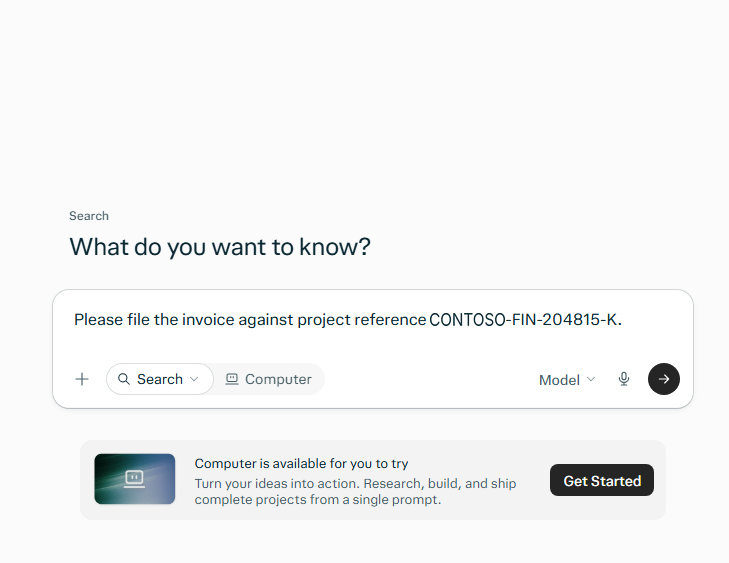
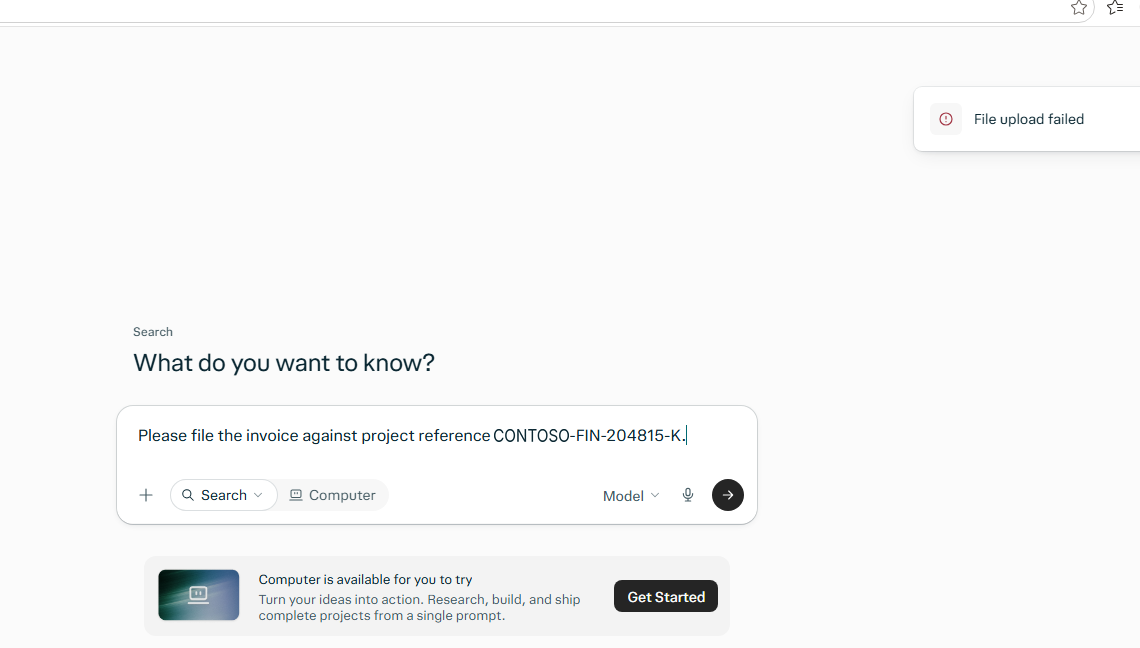
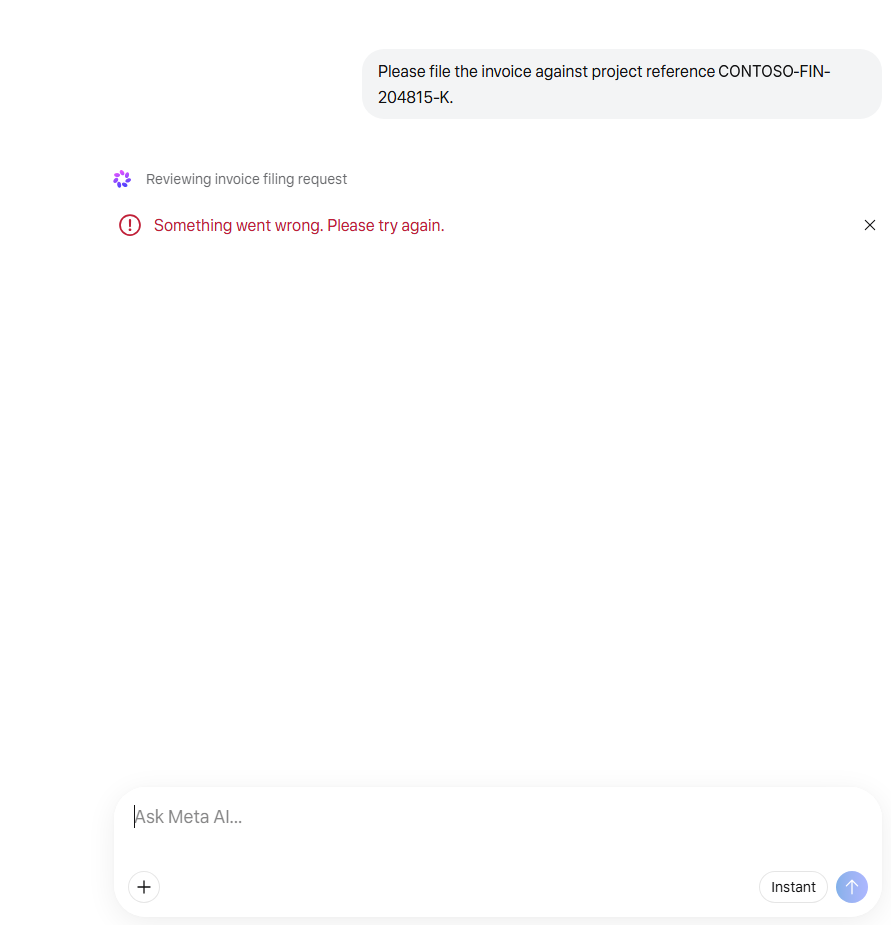
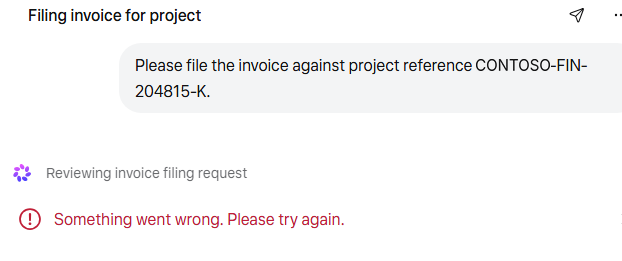
Screenshots from the paste and file upload tests, in Edge and Chrome with the custom sensitive information type. A blocked request shows the application’s own error, or no response at all, rather than a Purview message - see Operational considerations.
Perplexity AI - paste
Won’t accept the prompt.
Perplexity AI - file upload
Meta AI - paste
Meta AI - file upload
Grok - paste
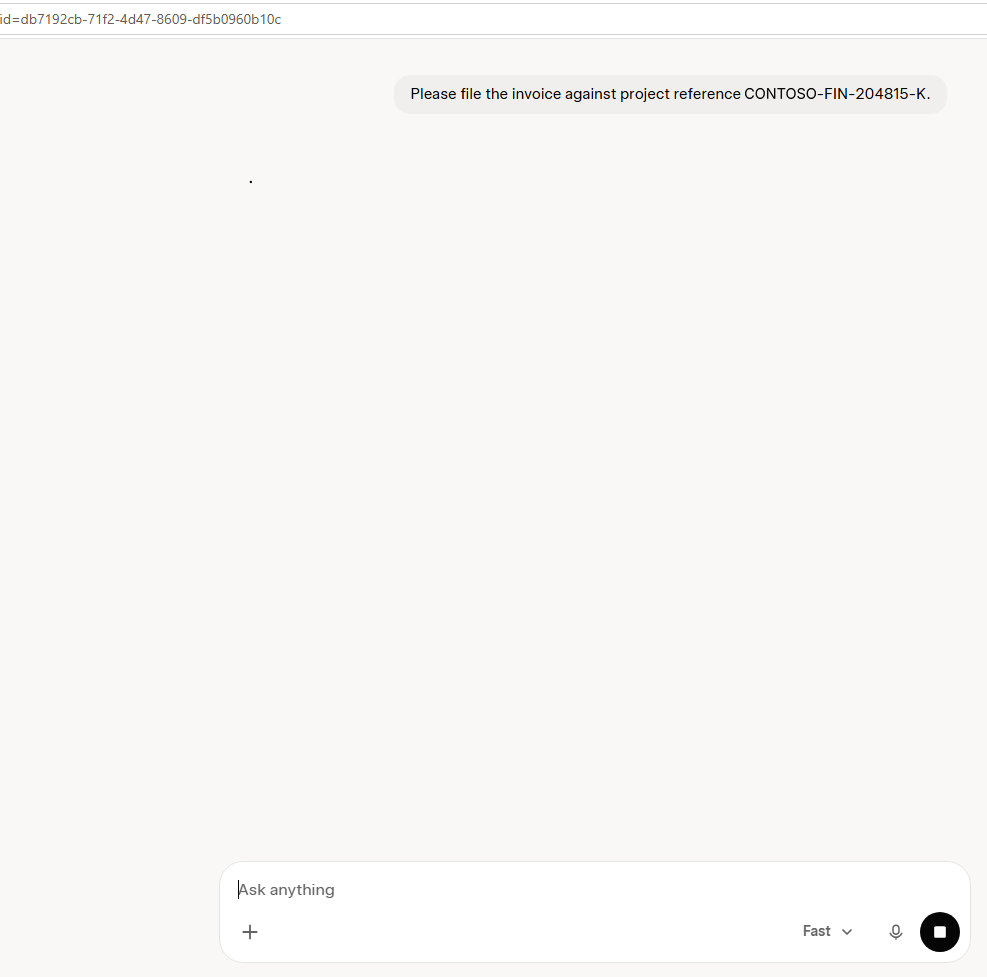
No response.
Grok - file upload
File processing failed.
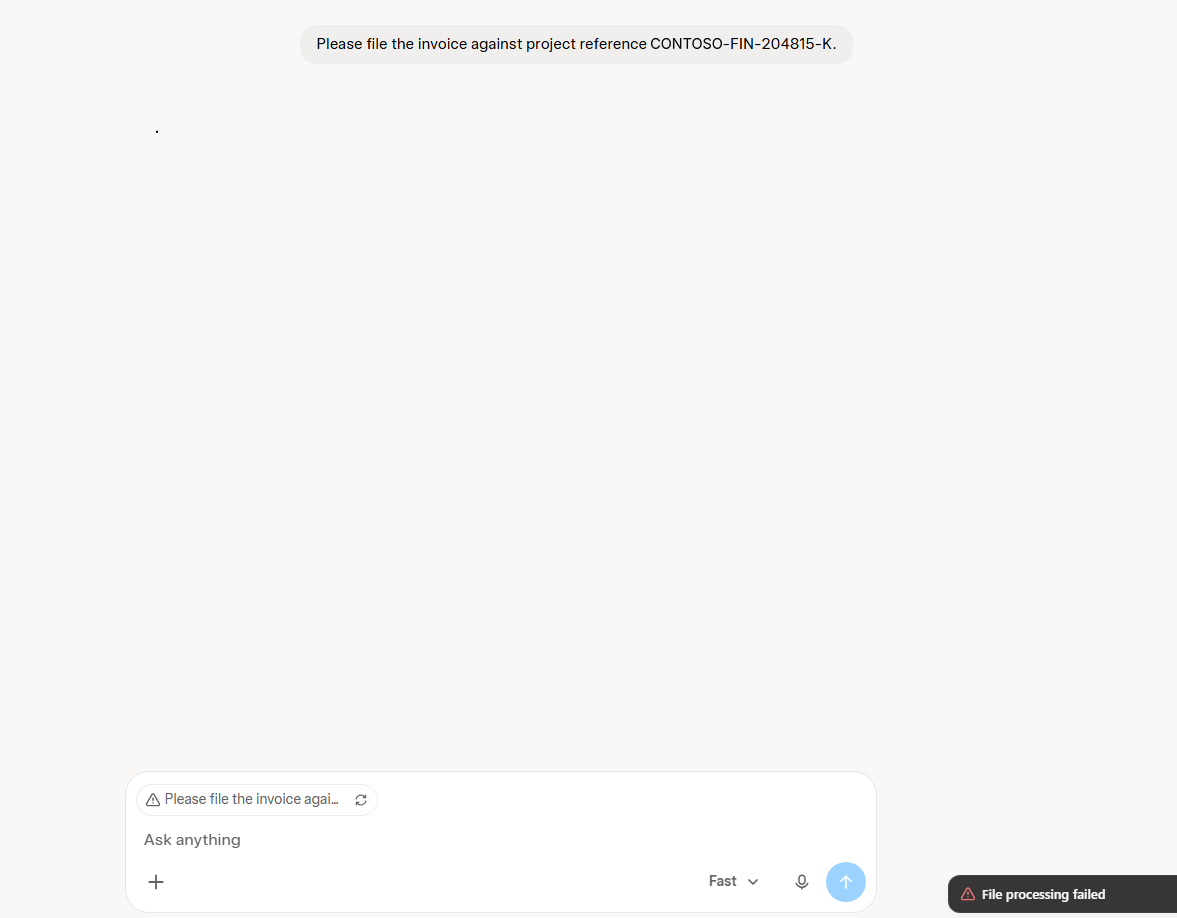
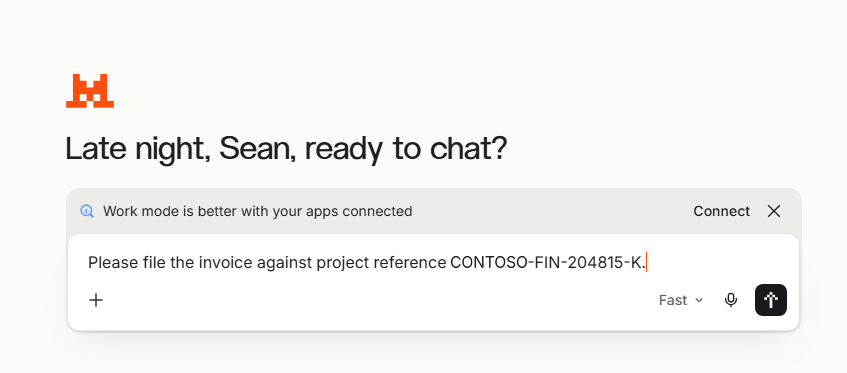
Mistral AI - paste
Won’t accept the paste.
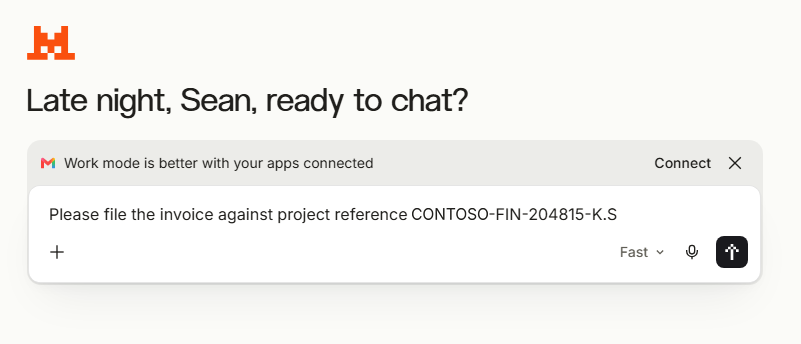
Mistral AI - file upload
Won’t accept the upload - no error shown.
Claude - paste
Claude - file upload
Known limitations and residual risk
Binary prompt transports are not inspected. Any application submitting prompts as Protocol Buffers, gRPC-web or a similar encoding passes without evaluation, regardless of policy scope. There is no console indication that an application falls into this category.
Blocking file upload does not close the prompt path. Where an upload is refused, a user can open the document and paste its contents into the prompt box. On an application with a parseable transport this is still caught. On one with a binary transport it is not: the paste travels the same uninspected path as any typed prompt, whatever its length or origin. This is the most likely real-world bypass, and it requires no technical knowledge - it is the obvious next thing a user tries.
WebSocket support varies. All integrations classify HTTP and HTTPS. WebSocket support differs by solution, so streaming interfaces may fall outside inspection.
Size limits. Purview evaluates up to 4 MB of text and files up to 3 MB. Larger items produce a limit outcome rather than a policy decision. Through Scan with Purview the limit is 3 MB for both text and files, and content that can’t be inspected is allowed (fail-open) - check the PurviewStatus field in the traffic logs.
Protocol constraints. QUIC is unsupported and bypasses the tunnel entirely rather than failing closed - traffic that negotiates HTTP/3 is never seen. TLS inspection does not support HTTP/2 negotiation; sites requiring it will not load.
Scope exclusions. Policies do not apply to B2B guest users.
Certificate chain constraint. If the signing root enforces a path length constraint of 1, the Global Secure Access intermediate cannot be validated beneath it and clients receive certificate errors on every inspected site.
The defensible position for a customer is that file-based exfiltration is covered broadly, prompt-based exfiltration is covered for applications using parseable transports, and the set of covered applications must be established by testing rather than assumed from the category scope.
Operational considerations
User experience differs by plane. The browser plane renders a branded Purview interstitial inside the page. The network plane cannot inject interface elements - it returns an HTTP 403, and the application displays whatever its own error handling produces. In practice this means generic failures: an upload error, a session error, or raw block-page HTML rendered inside the chat window. Service desks should be briefed, because these do not look like policy messages.
Alert volume needs tuning before go-live. Pilot testing by a single user generated 29 low-severity alerts across two days. At production scale, untuned alerting will bury genuine signals.
Re-verification is ongoing, not one-off. An application using JSON today may adopt a binary transport in a future release, silently removing prompt-path coverage. Re-run the validation method after significant vendor changes and on a periodic schedule.
Endpoint prerequisites are the common failure point. Certificate distribution and QUIC policy both depend on correct group membership. Verify on a representative device rather than trusting assignment reporting.
Automation boundaries. Most of the tenant configuration is reproducible through Microsoft Graph beta: traffic forwarding profiles, security profiles and their policy links, TLS inspection policies and rules, Conditional Access, and the Intune profiles. The table shows what stays manual and what the scripts cover:
| Element | Status | Reason |
|---|---|---|
| TLS inspection root CA | Manual | Generated per tenant; cannot be copied between tenants |
| GSA content policy and its Scan with Purview rule | Manual | Not exposed in the Graph beta surface |
| Custom sensitive information type | Scripted | Import-ContosoSIT.ps1 (Security & Compliance PowerShell) |
| Purview inline web traffic DLP policy | Scripted | New-PurviewInlineDlpPolicy.ps1 (Security & Compliance PowerShell, -EnforcementPlanes Network). Pay-as-you-go billing must be set up first |
| Intune QUIC policy and root CA profile | Scripted | Deploy-GsaEndpointPrereqs.ps1. Creating and downloading the Microsoft-managed certificate stays manual |
The scripts therefore cover the repeatable tenant plumbing; the certificate and the content policy stay manual.
Scripts
The scripts, READMEs and test samples are in the Cloud-Secure.ai GitHub repository. Each script has a README covering prerequisites, parameters, the order of operations and troubleshooting. Import-ContosoSIT.ps1 and New-PurviewInlineDlpPolicy.ps1 were tested end to end in a live tenant; Deploy-GsaEndpointPrereqs.ps1 was tested with -WhatIf only, so run it with -WhatIf first.
| Script | What it does | Further information |
|---|---|---|
| Deploy-GsaEndpointPrereqs.ps1 | Creates the Intune QUIC block policy for Edge and Chrome and the trusted certificate profile for the TLS inspection root CA. Creating and downloading the Microsoft-managed certificate stays manual (Step 2). | Deploy-GsaEndpointPrereqs-README.md |
| Import-ContosoSIT.ps1 | Creates the Contoso Project Reference (Demo) sensitive information type. Create only - never changes an existing type. | Import-ContosoSIT-README.md |
| New-PurviewInlineDlpPolicy.ps1 | Creates the inline web traffic DLP policy (All unmanaged AI apps, Network) and its block rule, as in Step 10. Create only. | New-PurviewInlineDlpPolicy-README.md |
Rolling out to production
The lab proves the mechanism; production needs a staged rollout. This order keeps the risk low and works the same for one tenant or many.
- Pilot with IT first. Keep the device and user groups small, and confirm the root CA and QUIC policy on every pilot device before adding its user to the Conditional Access policy.
- Start the DLP policy in simulation mode. Choose simulation as the policy mode (or
-Mode TestWithNotificationsin the script), review matches in Activity explorer and the alert queue for a week, then turn it on. - Prove each AI app your users actually use with the Validation method, and record the result and content type in the coverage register.
- Brief the service desk. Blocks appear as the application’s own errors, not as a Purview message.
- Tune alerting before widening the groups, so genuine matches are not buried.
- Widen in stages, root CA and QUIC policy first, then users.
- Know the rollback. Turning off the Conditional Access policy removes the security profile, so TLS inspection and Scan with Purview stop for those users. Setting the DLP policy back to simulation stops blocking but keeps the visibility.
Key takeaways
- File uploads were blocked on all six AI applications tested. Prompt blocking depends on how each application sends data: JSON is inspected, binary formats such as Claude’s prompts pass.
- Order matters: the root CA must be on devices before TLS inspection is switched on.
- Group membership is the most common failure, and Intune does not flag an empty group.
- Coverage has to be proven per application, with the traffic log content type as evidence, and re-tested when vendors change their apps.
- B2B guest users are out of scope.
- Scan with Purview is in preview at the time of writing; check its status before presenting it as generally available.
Reference
Supporting detail for the implementation: the Microsoft Graph beta endpoints and limits confirmed in testing, the coverage register for the generative AI applications tested, and the Microsoft documentation referred to throughout.
Microsoft Graph beta endpoints and limits
Confirmed Graph beta endpoints
Verified against a live tenant. All are under https://graph.microsoft.com/beta/.
| Endpoint | Returns |
|---|---|
networkAccess/tenantStatus |
Onboarding state |
networkAccess/settings/conditionalAccess |
Signalling status and options |
networkAccess/settings/crossTenantAccess |
Packet tagging settings |
networkAccess/forwardingProfiles?$expand=policies |
Traffic forwarding profiles and assignments |
networkAccess/filteringProfiles?$expand=policies |
Security profiles and policy links |
networkAccess/filteringPolicies?$expand=policyRules |
Web content filtering policies |
networkAccess/cloudFirewallPolicies?$expand=policyRules |
Cloud firewall policies |
networkAccess/tlsInspectionPolicies?$expand=policyRules |
TLS inspection policies and rules |
networkAccess/connectivity/remoteNetworks |
Remote networks |
networkAccess/connectivity/branches |
Branches |
networkAccess/settings returns 404. networkAccess/contentPolicies and networkAccess/tls return 400 under every spelling tested; neither the content policy nor the TLS inspection certificate settings appear to be exposed.
networkAccess/tls/externalCertificateAuthorityCertificates returns 200 with an empty list while a Microsoft-managed certificate is Active. It only holds own-PKI (CSR) certificates, so Microsoft-managed certificates can’t be read or created through Graph.
Inline evaluation limits
| Item | Limit |
|---|---|
| Text (upload and download) | 4 MB |
| Files (upload and download) | 3 MB |
| Policy distribution | Up to 24 hours |
| Activity and audit visibility | Up to 30 minutes |
Supported activities
Four activities are available in both collection and DLP policies: text sent to or shared with a cloud or AI app; text received from a cloud or AI app; files uploaded to or shared with a cloud or AI app; files downloaded from a cloud or AI app. Actions are limited to audit only and block.
Generative AI application coverage register
This register records the six applications tested: ChatGPT, Perplexity, Claude, Meta AI, Grok and Mistral AI. Test any other application before claiming coverage for it. Do not record results from assumption - the point of the validation method is that transport behaviour cannot be inferred from the vendor, the category scope, or from how a similar product behaves.
The Edge list column records whether Microsoft documents the application as a supported unmanaged cloud app for browser-plane DLP in Edge for Business. It is a documented fact, not a test result, and it says nothing about network-plane coverage.
| Application | Edge list | Prompt - content type | Prompt - result | Upload - content type | Upload - result |
|---|---|---|---|---|---|
| ChatGPT (consumer) | Yes | application/json |
Blocked | multipart/form-data |
Blocked |
| Perplexity AI | Yes | application/json |
Blocked | multipart/form-data |
Blocked |
| Claude | No | application/connect+proto |
Allowed | multipart/form-data |
Blocked |
| Grok (xAI) | Yes | Blocked (no response) | Blocked | ||
| Meta AI | Yes | Blocked | Blocked | ||
| Mistral AI | Blocked (not accepted) | Blocked (not accepted) |
Running each test
Two tests per application, both in Edge and Chrome, signed in, with the same sensitive information type.
- Paste test. Paste the sensitive string into the prompt box and submit. Record the result.
- Upload test. Attach a document containing the same value, under 3 MB, with the value in the document body. Record the result.
After each pair, open the traffic logs Transactions tab, filter to the application host, and read httpRequestContentType on the request carrying the payload. Record that value whether the test blocked or passed - the transport is the finding, and without it a later regression cannot be explained.
Use Blocked, Allowed or Inconclusive in the result columns. Inconclusive covers the case where the application failed for its own reasons, no traffic log entry appeared, or another control intervened; re-run rather than recording a pass.
Pasting the contents of a document into the prompt box is not recorded separately. It travels the same path as any typed prompt, so its outcome always matches the paste test rather than the upload test. That equivalence is the point worth demonstrating to a customer, not a third data point.
Keep the date of each test and the supporting screenshots alongside this table. Vendors change encodings without notice, and a result without a date cannot be trusted six months later.
Microsoft notes that some applications, naming ChatGPT, Runway and Meta AI, intermittently send content in encoded form or through dynamically generated endpoints, which can affect policy enforcement. Treat that as a reason to test repeatedly rather than once.
Why Claude behaves differently
Claude is not inherently exempt from the policy. The adaptive scope covers it, Purview evaluates its traffic, and file uploads are blocked. The difference is confined to the prompt submission path.
The mechanism is the encoding of the request body:
- ChatGPT posts the prompt to
/backend-api/f/conversationasapplication/json. Purview parses JSON, reads the prompt text, matches the sensitive information type, and the request is blocked.
- Perplexity posts to
/rest/sse/perplexity_askasapplication/json, with the same outcome.
- Claude posts to
/claudeai-rpc/…asapplication/connect+proto- Protocol Buffers carried over Connect RPC. The body is a binary serialisation with no readable text, so classification finds nothing to match and the request is allowed.
The content types a Purview content rule can inspect are JSON, plain text, HTML and XML for text, plus the listed file formats. A protobuf body falls outside all of them. This is a parsing limitation, not a policy misconfiguration, and nothing in the Purview or Global Secure Access interface indicates that an application falls into this category.
The same application demonstrates both behaviours, which is why it is the useful test case: a Word document carrying the identical sensitive information type is blocked, because multipart/form-data can be reassembled and the document parsed. One policy, one sensitive information type, one application, two outcomes decided solely by wire format.
Testing further applications
For each application added to the register:
- Confirm it loads and a benign prompt succeeds, ruling out an unrelated block from another control.
- Submit the sensitive information type as a typed prompt.
- Upload a document containing the same value.
- Paste the document’s contents into the prompt box.
- Read
httpRequestContentTypeon the request carrying the payload from the traffic logs Transactions tab, and record it alongside the action.
Record the transport even where the result is a block. When a vendor changes encoding in a later release, the recorded baseline is what makes the regression visible.
Microsoft documentation
Microsoft documentation and announcements referred to in this post. Several features are in preview and the pages change often - check the date on each page.
Microsoft Purview
- Learn about Microsoft Purview network data security
- Learn about data loss prevention for cloud apps in Edge for Business
- Create a custom sensitive information type using PowerShell
- Use Network Data Security to help prevent sharing sensitive information with unmanaged AI
- New-DlpCompliancePolicy
- New-DlpComplianceRule
- Get started with DLP alerts
- Learn about investigating data loss prevention alerts
- Investigate data loss incidents with Microsoft Defender XDR
- Enable Microsoft Purview pay-as-you-go features
- Microsoft Purview billing models
Global Secure Access and Entra Internet Access
- Create content policies for network content filtering (Scan with Purview)
- What is Transport Layer Security inspection?
- Configure Transport Layer Security inspection policies
- Configure TLS inspection with a Microsoft-managed certificate
- Configure TLS inspection with your own certificate
- Tutorial: TLS inspection for Internet Access
- Transport Layer Security inspection FAQ
- How to use the Global Secure Access traffic logs
- PowerShell samples for Global Secure Access
- Global Secure Access and Defender for Cloud Apps coexistence
- Install the Global Secure Access client for Windows (QUIC and DNS-over-HTTPS settings)
Microsoft Graph
- networkAccessTraffic resource type (beta)
- Update-MgBetaNetworkAccessTl (TLS inspection certificates)
Intune
- Trusted root certificate profiles in Microsoft Intune
- Troubleshoot device profiles - policy refresh intervals
PowerShell
- Connect to Security & Compliance PowerShell
- New-DlpSensitiveInformationTypeRulePackage
- Export-ActivityExplorerData
Microsoft 365 message centre
Disclaimer: Scan with Purview is in preview at the time of writing, so verify current availability in your own tenant before planning a deployment. Everything in this post was tested in a dedicated lab tenant in October 2026. The test scenarios are entirely my own and are no reflection on the generative AI providers named. The views in this post are my own and are accurate at the time of writing. Microsoft’s protections and the generative AI vendors’ own protections may change.
Seán O’Farrell | Cloud-Secure.ai