One page that answers: how healthy is our security posture?
Ask the Contoso security team how healthy its security posture is, and the answer takes a tour of the portal. The device inventory, filtered by hand. The onboarding page. The security recommendations. The incidents queue. The attack surface reduction report. Every page answers part of the question, none of them answers all of it, and a manager asking for a weekly view gets a set of screenshots.
This series builds the alternative: a single page in the Microsoft Defender portal that answers the whole question, keeps itself up to date, and needs nothing extra installed to make it work.
Who this series is for
The series is written for two kinds of reader, and each part works for both.
- If you lead or manage security, read this guide and the In plain terms box and Key takeaways in each part. They explain what each section of the dashboard tells you and what good looks like - no code required.
- If you run Defender day to day, each part gives you the queries, the settings and real screenshots to build the dashboard yourself - or import the finished version from GitHub in a few minutes.
What the dashboard shows
| Part | Section | Question it answers |
|---|---|---|
| 1 | Device health | Are all our devices reporting in, and are the servers that control our identities covered? |
| 2 | Protection controls | Are antivirus, tamper protection, attack surface reduction rules, BitLocker and the firewall actually switched on? |
| 3 | Alerts and attack surface reduction | What is raising alerts, and which attack-blocking rules are ready to move from test mode to blocking? |
Each part adds one section to the same dashboard. Together they answer the question a manager actually asks: are we watching every device, are the protections on, and what is happening right now?
The jargon, in one line each
| Term | What it means |
|---|---|
| Microsoft Defender portal | Microsoft’s security console (security.microsoft.com), where alerts, devices and investigations live |
| Workbook | A dashboard page inside the portal, built from charts and tables that update themselves |
| Advanced hunting | The portal’s search engine over the last 30 days of security data |
| KQL | Kusto Query Language - the language advanced hunting uses to ask questions of that data |
| Sensor | The part of Defender for Endpoint on each device that reports what happens on it |
| Tier 0 servers | The few servers that control identity - domain controllers, AD CS, AD FS and Entra Connect. Compromise one and an attacker can reach everything |
| Tamper protection | A setting that stops anyone, including an attacker, switching Defender off |
| EDR | Endpoint detection and response - Defender’s ability to spot an attack in progress and act on it |
| ASR rules | Attack surface reduction rules - switches that block common attack techniques, such as an Office document launching a program |
| Defender Vulnerability Management | The part of Defender that checks every device’s settings against Microsoft’s recommended configuration |
Why a workbook in the Defender portal
- It reads advanced hunting directly. Every table Contoso already uses for hunting - device, vulnerability management, alert and event data - can drive a section. There is no data export, no Log Analytics workspace and no Azure resource to build first.
- It is live. Each section runs its query whenever the workbook opens or refreshes, and auto refresh can rerun everything on a schedule, from every five minutes to once a day.
- It respects each viewer’s access. A viewer sees only the data their own permissions allow, so the same workbook works for the central security team and for a regional team limited to its own devices.
- It is shareable and portable. Workbooks are saved for the whole organisation, and the dashboard exports as one file that imports into another tenant in seconds.
Live data and history
Device, alert and event data is current to within minutes. The protection control sections read Defender Vulnerability Management assessments, which Defender updates on its own schedule rather than continuously. Advanced hunting keeps 30 days of data, so the dashboard shows the current state and the last month - which is exactly what a weekly review needs.
An example, not the limit
The three sections in this series are an example of what a Defender workbook can do, not a boundary. Any table in the advanced hunting schema can become a section, so the same approach extends well beyond device health and alerts. A few directions Contoso could take next:
| Use case | Advanced hunting table | What it could show |
|---|---|---|
| Sensitive file activity on devices | DeviceFileEvents | Files with a sensitivity label that were created, modified, renamed or copied, by label and by device |
| Purview data security signals | DataSecurityEvents (preview) | Activity matched to sensitive information types and DLP policies, shared from Insider Risk Management |
| Generative AI app usage | CloudAppEvents, DeviceNetworkEvents | Which users and devices use generative AI apps and services, and how often |
| Local AI agents | AgentsInfo | AI agents discovered on onboarded devices, with their versions |
| Sign-in and email risk | IdentityLogonEvents, EmailEvents | Failed sign-ins on Tier 0 accounts, and phishing delivered or blocked |
Each use case follows the same pattern as the sections in this series: write the query in advanced hunting, check the results, then add it to the workbook as a new section. Some tables depend on other products or settings - DataSecurityEvents, for example, is populated only when Insider Risk Management shares its alerts with Defender - so confirm a table returns data in your own tenant first.
Where the dashboard lives
The finished dashboard sits in the Defender portal under Workbooks (security.microsoft.com/sentinel/workbooks), alongside Microsoft’s example workbooks. Part 1 shows how to create it, save it and open it again.
What you need
- Workbooks in the Defender portal. Available to tenants using Microsoft Sentinel in the Defender portal, and to tenants on the Integrated Security Operations Center (ISOC) preview - Microsoft Defender Suite, Microsoft 365 E5 or E7 without an active Sentinel workspace.
- To build it: the Workbooks Unified RBAC permission with Manage access, or the Security Administrator role.
- To view it: the Workbooks permission with Reader access, or the Security Reader role.
- Data: devices onboarded to Defender for Endpoint, and Defender Vulnerability Management for the Part 2 controls.
How the series works
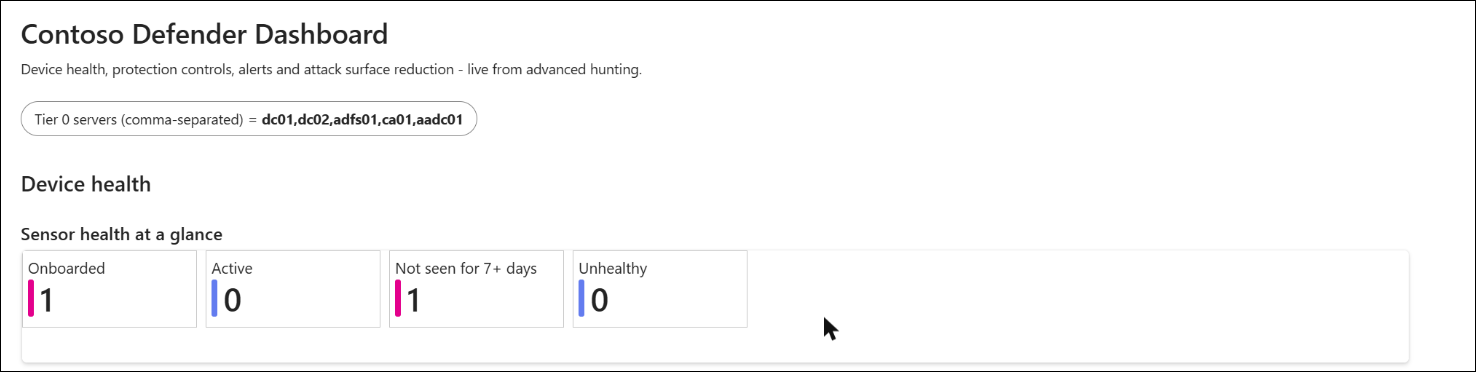
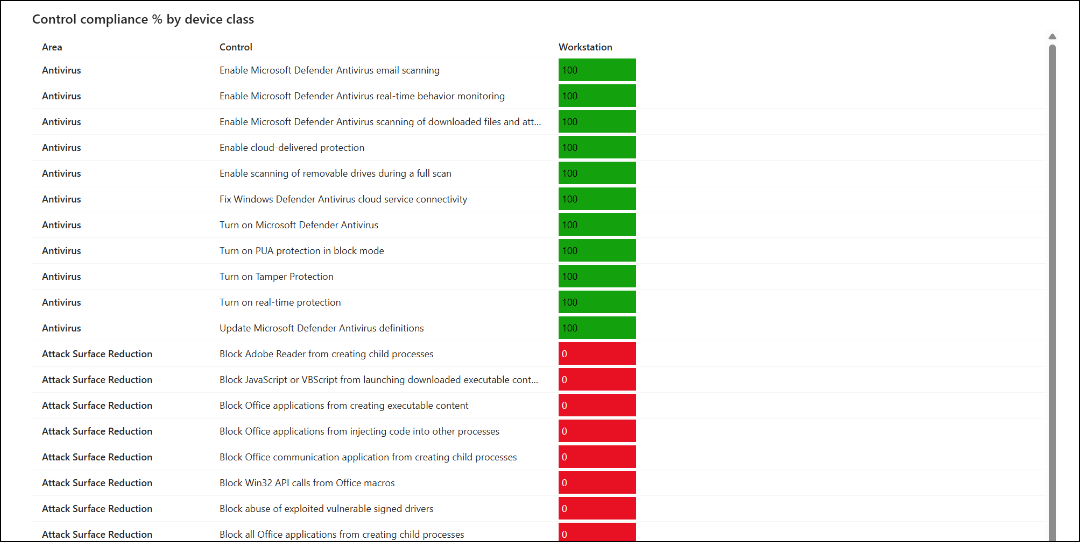
Every query is shown in full and explained in the post that uses it. Every screenshot comes from a real lab tenant, so you will see what the dashboard looks like with real gaps in it - including a device that has stopped reporting and a set of attack surface reduction rules that were never switched on.
If you would rather start with the finished product, the companion repository has the complete workbook as a single file, ready to import, together with every query as a .kql file.
GitHub: github.com/cloud-secure-ai/Building-a-Defender-Security-Dashboard
The series
- Part 1: Workbooks in the Defender portal, and device health
- Part 2: Are the protections actually on?
- Part 3: Alerts and attack surface reduction
References
- Create and manage workbooks in Microsoft Defender - Microsoft Learn
- Integrated Security Operations Center (ISOC) overview - Microsoft Learn
- Monthly news - July 2026 - Microsoft Tech Community
- Advanced hunting schema tables - Microsoft Learn
- DataSecurityEvents table - Microsoft Learn
Seán O’Farrell | cloud-secure.ai


Pingback: Defender Security Dashboard Part 3: Alerts and attack surface reduction | Cloud-Secure.ai
Pingback: Defender Security Dashboard Part 2: Are the protections actually on? | Cloud-Secure.ai
Pingback: Defender Security Dashboard Part 1: Workbooks in the Defender portal, and device health | Cloud-Secure.ai