Series: This is Part 1 of 3 in my series on building a Defender security dashboard with workbooks. New to the series? Start with the series guide, which explains what the dashboard shows and what you need.
In plain terms: Every device in the organisation should have a Defender sensor reporting in. A device that goes quiet is a blind spot: if it is attacked, nobody sees it, and Defender does not raise an alert to say it has stopped reporting. This part builds the first page of the dashboard, which answers two questions a manager can act on: are all our devices reporting, and are the servers that control our identities covered?
The series guide set out the goal: one page in the Defender portal that shows how healthy Contoso’s security posture is, built entirely on advanced hunting. This part creates the workbook and builds its first section - device health.
Workbooks in the Defender portal
A workbook is a dashboard page made of sections: text, parameters and queries. Each query section asks advanced hunting a question in KQL and shows the answer as a table, chart or tiles.
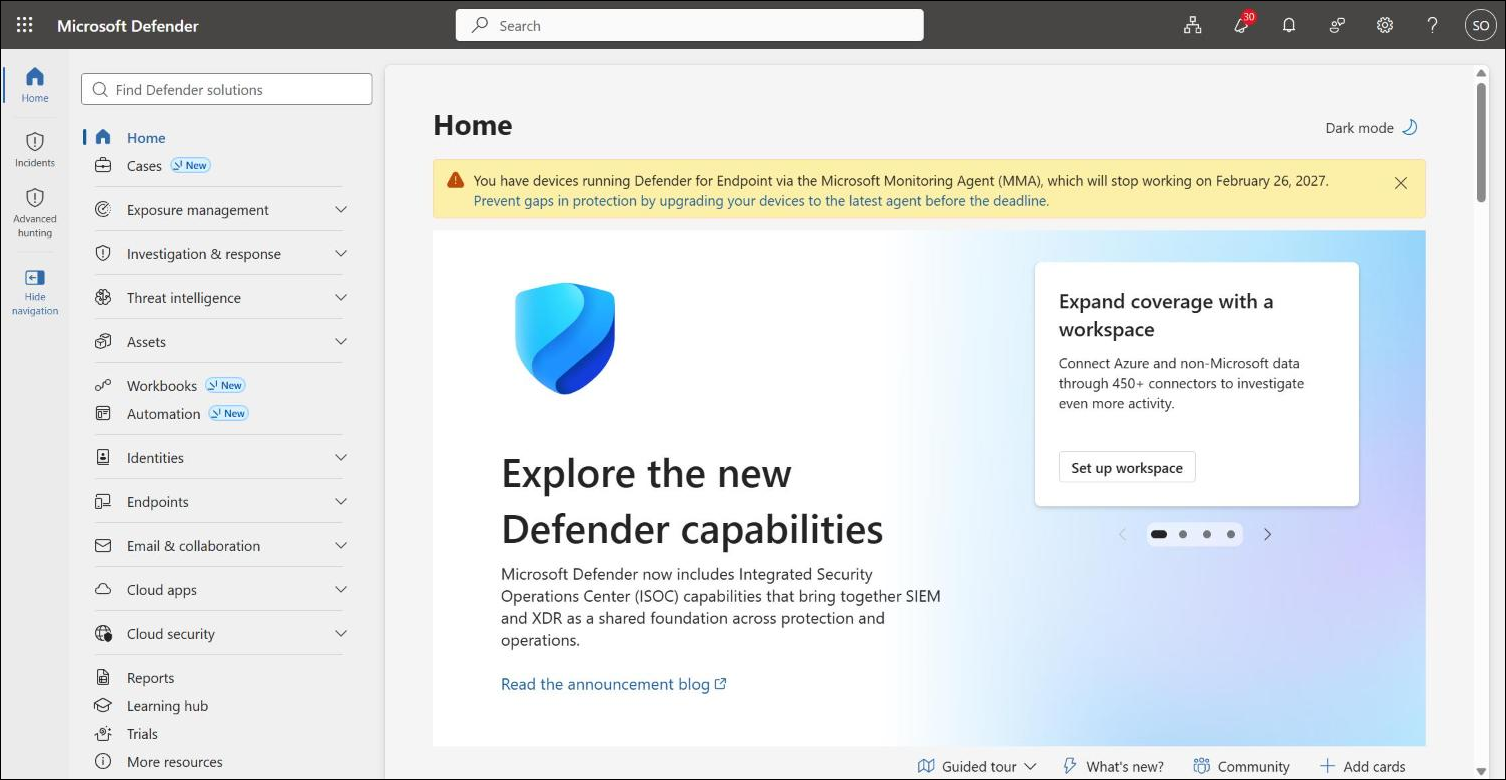
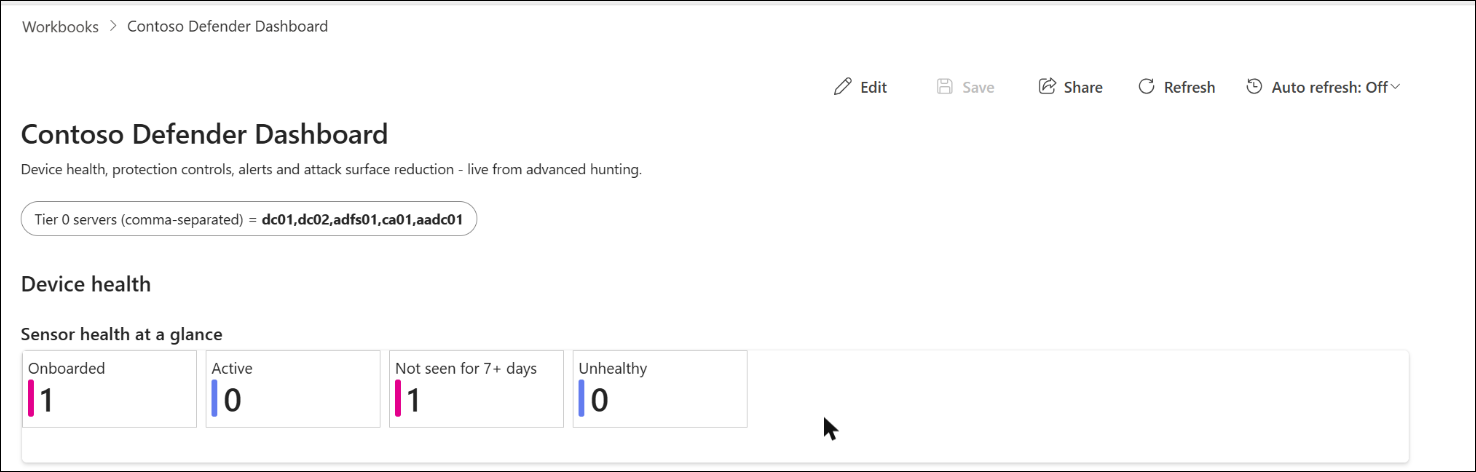
Workbooks sits in the Defender portal navigation. Tenants that use Microsoft Sentinel in the Defender portal reach it under Microsoft Sentinel; tenants on the Integrated Security Operations Center (ISOC) preview get it as a top-level item, as shown above, without needing a workspace.
Create the workbook
- Go to Workbooks and select + Add workbook, then Edit.
- Replace the default text with a heading such as Contoso Defender Dashboard.
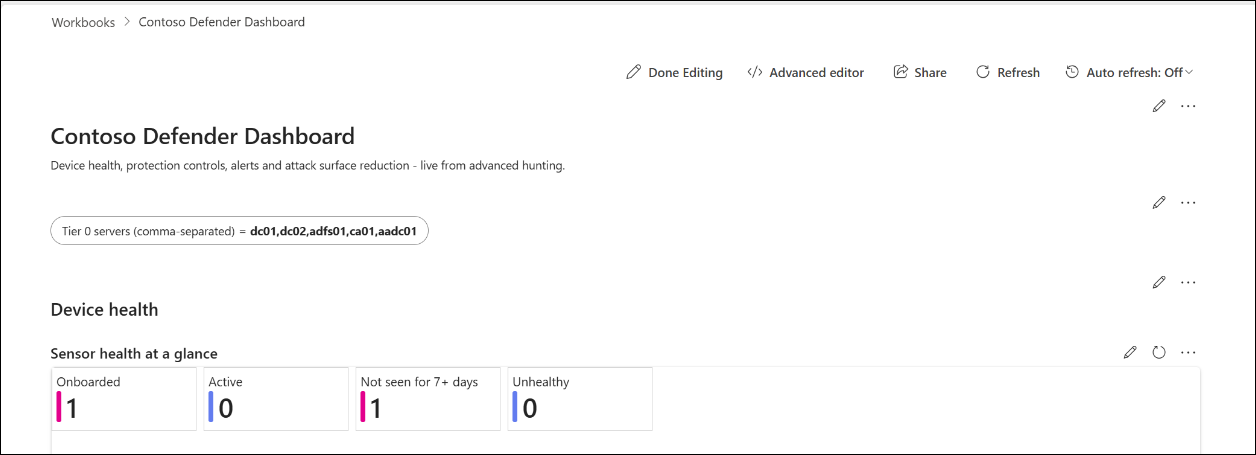
Save once, then reopen. In testing, every Save on an unsaved new workbook page created a separate copy. Save the first time, then open the workbook from the Workbooks list before making further changes.
Add a parameter for Tier 0 servers
Domain controllers, AD CS, AD FS and Entra Connect servers deserve their own view, and only Contoso knows their names. Add a parameters section with one text parameter called IdentityServers, and enter the short host names separated by commas, for example dc01,dc02,adfs01,ca01,aadc01. Queries in this series read it as {IdentityServers}.
Device health
Each of the following is a query section: select Add, choose a query section, set Data source to Advanced hunting, leave Time range as Set in query, paste the query, select Run query, choose the visualisation and select Apply changes.
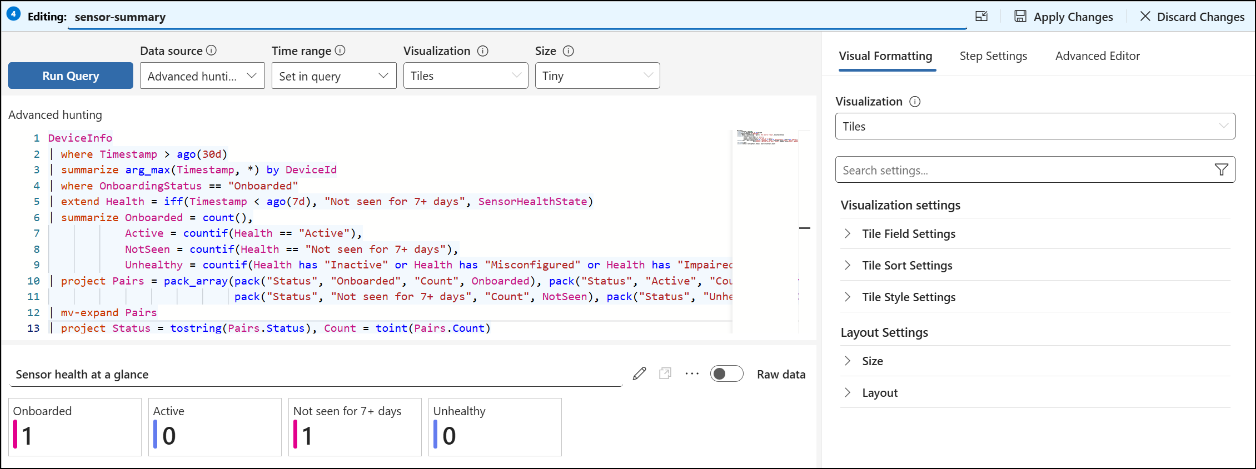
Why 30 days? A device that stops reporting also stops appearing in short time windows, so a 7-day query quietly drops the very devices you are looking for. These queries look back 30 days for each device’s last record, and flag any device not seen for more than 7 days.
1. Sensor health at a glance
The headline: how many devices are onboarded, how many are reporting normally, and how many have gone quiet or report a problem.
DeviceInfo
| where Timestamp > ago(30d)
| summarize arg_max(Timestamp, *) by DeviceId
| where OnboardingStatus == "Onboarded"
| extend Health = iff(Timestamp < ago(7d), "Not seen for 7+ days", SensorHealthState)
| summarize Onboarded = count(),
            Active = countif(Health == "Active"),
            NotSeen = countif(Health == "Not seen for 7+ days"),
            Unhealthy = countif(Health has "Inactive" or Health has "Misconfigured" or Health has "Impaired")
| project Pairs = pack_array(pack("Status", "Onboarded", "Count", Onboarded), pack("Status", "Active", "Count", Active),
                             pack("Status", "Not seen for 7+ days", "Count", NotSeen), pack("Status", "Unhealthy", "Count", Unhealthy))
| mv-expand Pairs
| project Status = tostring(Pairs.Status), Count = toint(Pairs.Count)
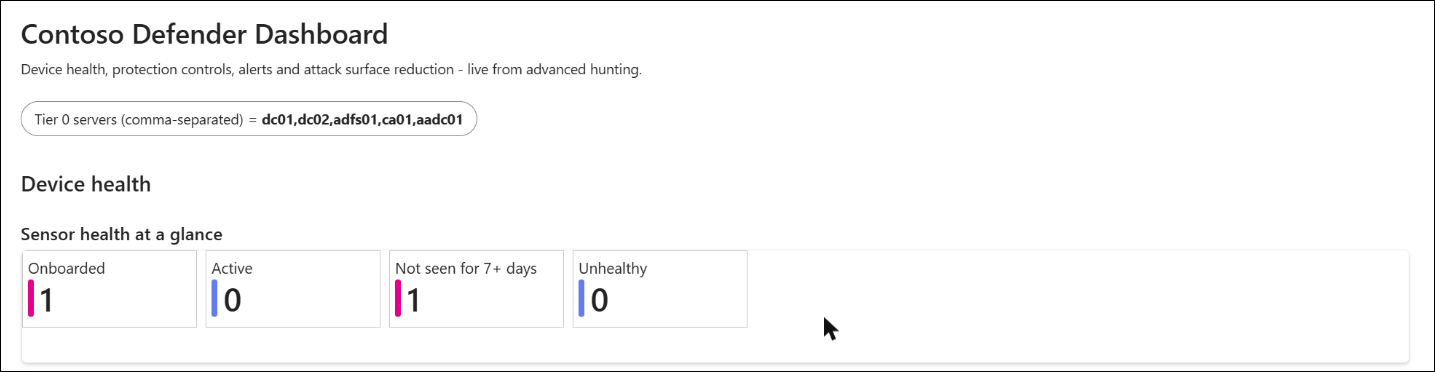
Show this as tiles. The last two numbers should be close to zero. In the lab, the single test device has not reported for over a week, and the tile shows it immediately.
2. Sensor health by device class
The same numbers split by type of device, so it is clear where the problems sit.
DeviceInfo
| where Timestamp > ago(30d)
| summarize arg_max(Timestamp, *) by DeviceId
| where OnboardingStatus == "Onboarded"
| extend Health = iff(Timestamp < ago(7d), "Not seen for 7+ days", SensorHealthState)
| extend Class = case(DeviceType == "Server" and OSPlatform startswith "Windows", "Windows server",
                      OSPlatform == "Linux", "Linux",
                      DeviceType == "Workstation", strcat("Workstation - ", OSPlatform), OSPlatform)
| summarize Devices = count(),
            Active = countif(Health == "Active"),
            NotSeen = countif(Health == "Not seen for 7+ days"),
            Inactive = countif(Health == "Inactive"),
            Misconfigured = countif(Health has "Misconfigured"),
            Impaired = countif(Health has "Impaired") by Class
| order by Devices desc
Workstations that have not been seen are often laptops left switched off; a server that has not been seen almost never has a good reason.

3. Devices that have stopped reporting
The list that turns a number into a task: every device that has gone quiet or reports a problem, and how long it has been silent.
DeviceInfo
| where Timestamp > ago(30d)
| summarize arg_max(Timestamp, DeviceName, OSPlatform, DeviceType, SensorHealthState, OnboardingStatus, MachineGroup) by DeviceId
| where OnboardingStatus == "Onboarded"
| extend DaysSinceLastSeen = datetime_diff('day', now(), Timestamp)
| where SensorHealthState != "Active" or DaysSinceLastSeen >= 7
| project DeviceName, OSPlatform, DeviceType, SensorHealthState, LastSeen = Timestamp, DaysSinceLastSeen, DeviceGroup = MachineGroup
| order by DaysSinceLastSeen desc
The lab device still shows Active as its last sensor state - it simply stopped reporting, which is exactly why the 7-day check matters. Sort by DaysSinceLastSeen and work from the top: a device unseen for weeks is either retired, rebuilt under a new name, or a blind spot.

4. Tier 0 identity servers
Domain controllers and the other identity servers are the keys to the kingdom. This section checks each one by name, so a server that was never onboarded shows up as a gap instead of simply being missing from the results.
let names = split(tolower(replace_string("{IdentityServers}", " ", "")), ",");
let seen = DeviceInfo
| where Timestamp > ago(30d)
| summarize arg_max(Timestamp, DeviceName, OSPlatform, ClientVersion, SensorHealthState, OnboardingStatus, MachineGroup) by DeviceId
| extend Host = tolower(tostring(split(DeviceName, ".")[0]))
| where Host in (names)
| project Host, DeviceName, OnboardingStatus, SensorHealthState, ClientVersion, DeviceGroup = MachineGroup, LastSeen = Timestamp;
print Host = names
| mv-expand Host to typeof(string)
| where isnotempty(Host)
| join kind=leftouter seen on Host
| extend Status = iff(OnboardingStatus == "Onboarded" and SensorHealthState == "Active" and LastSeen > ago(7d), "Healthy", "Needs attention")
| project Host, Status, OnboardingStatus, SensorHealthState, ClientVersion, DeviceGroup, LastSeen
| order by Status desc, Host asc
Show the result as a table, and use an icon format on the Status column so problems stand out. A server counts as healthy only if it is onboarded, its sensor is active and it has reported in the last 7 days. The lab has no domain controllers, so every name in the parameter shows Needs attention - exactly what a missing server would look like.

5. Devices that can be onboarded
Defender also discovers devices on the network that are not yet protected. This section counts them by platform - the unmanaged devices attackers look for first.
DeviceInfo
| where Timestamp > ago(30d)
| summarize arg_max(Timestamp, OnboardingStatus, OSPlatform, DeviceType) by DeviceId
| where OnboardingStatus == "Can be onboarded"
| summarize Devices = count() by OSPlatform, DeviceType
| order by Devices desc
An empty result is good news. In the lab, device discovery found nothing waiting to be onboarded.

Save it
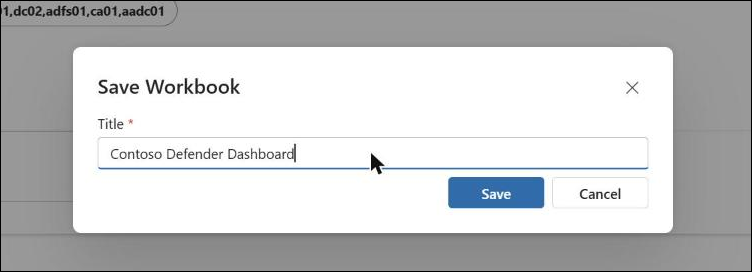
Select Done editing, then Save, and enter a title. The workbook is saved for the whole organisation and appears in the Workbooks list for anyone with Workbooks Reader access.
Opening the dashboard
- Sign in to the Microsoft Defender portal at security.microsoft.com.
- Select Workbooks in the navigation (under Microsoft Sentinel in Sentinel tenants), or browse directly to security.microsoft.com/sentinel/workbooks.
- Under My workbooks, select Contoso Defender Dashboard, then View saved workbook in the side panel.
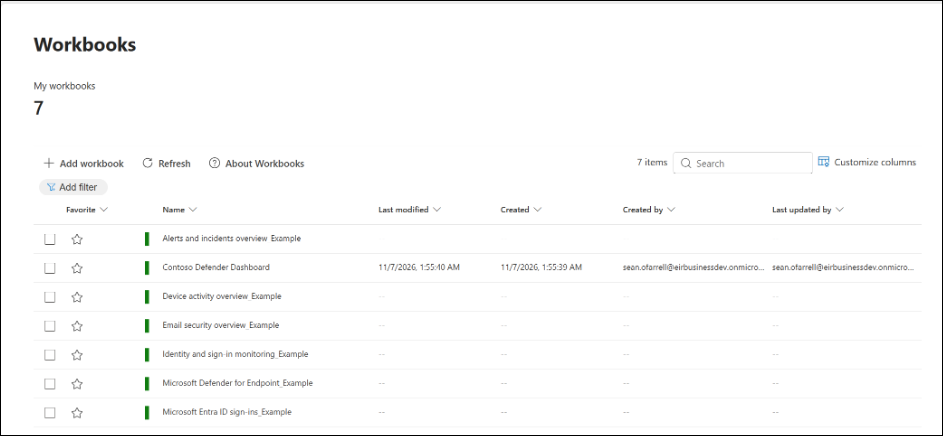
Select the star next to the workbook to add it to your favourites, so it stays at the top of the list. Anyone with Workbooks Reader access, or the Security Reader role, sees the same workbook in their own list.
The shortcut: import the finished workbook
The complete dashboard from all three parts is in the companion repository as DefenderDashboard.workbook. Create a new workbook, select Edit, then Advanced editor, replace the JSON with the file’s contents and select Apply. Every query section uses "queryType": "advancedHunting", so it runs in any tenant with the same tables.
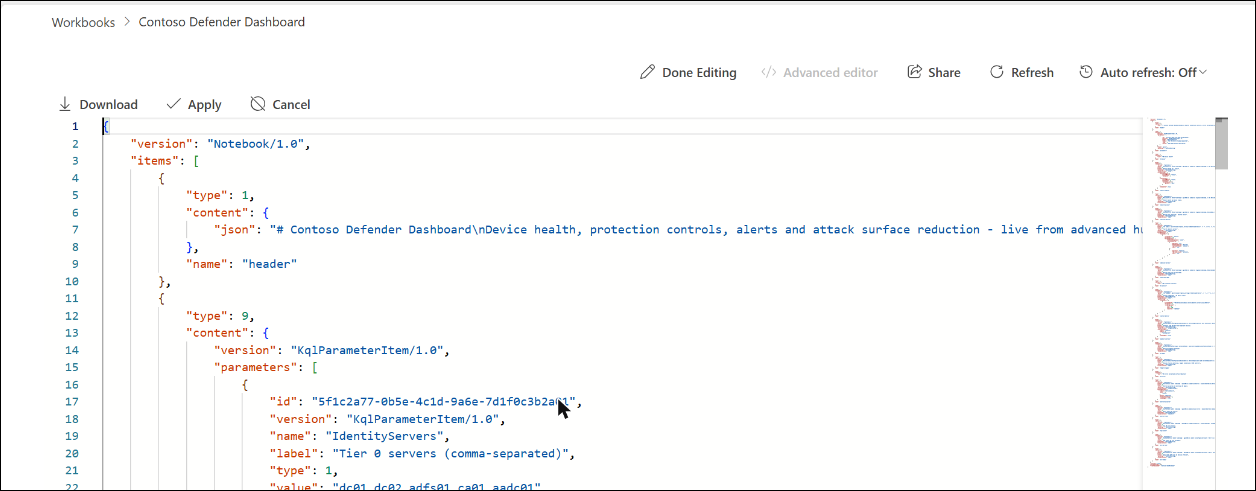
Every query is also in the repository as its own .kql file, ready to run in advanced hunting. Those files cannot read a workbook parameter, so the two queries that use {IdentityServers} have a let line marked // EDIT instead, where you type your Tier 0 host names.
GitHub: github.com/cloud-secure-ai/Building-a-Defender-Security-Dashboard
Key takeaways
- A device that stops reporting does not raise an alert - this section makes the silence visible.
- Look back 30 days, not 7, or the devices you most need to find drop out of the results.
- Check Tier 0 servers by name, so a server that was never onboarded shows up as a gap.
Next: Part 2
A device that reports is not the same as a device that is protected. Part 2 adds a single grid showing whether each protection is actually switched on, for every type of device.
The rest of the series
- Series guide: Building a Defender Security Dashboard with Workbooks
- Part 1: Workbooks in the Defender portal, and device health (this post)
- Part 2: Are the protections actually on?
- Part 3: Alerts and attack surface reduction
The workbook and every KQL query from the series are on GitHub: github.com/cloud-secure-ai/Building-a-Defender-Security-Dashboard
References
- Create and manage workbooks in Microsoft Defender - Microsoft Learn
- Integrated Security Operations Center (ISOC) overview - Microsoft Learn
- Monthly news - July 2026 - Microsoft Tech Community
- DeviceInfo table - Microsoft Learn
Seán O’Farrell | cloud-secure.ai


Pingback: Defender Security Dashboard Part 3: Alerts and attack surface reduction | Cloud-Secure.ai
Pingback: Defender Security Dashboard Part 2: Are the protections actually on? | Cloud-Secure.ai
Pingback: Building a Defender Security Dashboard with Workbooks: the series | Cloud-Secure.ai