Series: This is Part 3 of 3 in my series on building a Defender security dashboard with workbooks. New to the series? Start with the series guide, which explains what the dashboard shows and what you need.
In plain terms: The first two parts showed whether devices are being watched and whether their protections are on. This part shows what is actually happening: which security products are raising alerts, which alerts keep repeating, and which attack-blocking rules are ready to move from test mode (audit) to blocking. It also sets the dashboard to refresh itself, so it can sit on a screen in the security team’s office.
Alerts and attack surface reduction
As in Parts 1 and 2, add each query below as a query section with Advanced hunting as the data source and the time range Set in query.
1. Alerts by source and severity
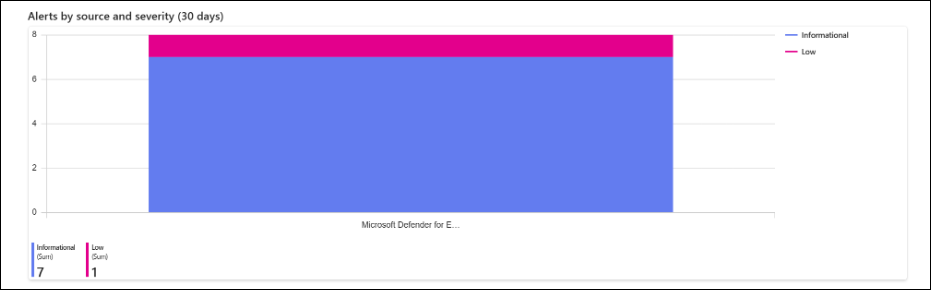
Which products are raising alerts, and how serious those alerts are.
AlertInfo
| where Timestamp > ago(30d)
| summarize Alerts = dcount(AlertId) by ServiceSource, Severity
| order by Alerts desc
AlertInfo holds alerts from across Microsoft Defender XDR, and Microsoft Purview alerts, such as Data Loss Prevention and Insider Risk Management, can appear there too, each with its own ServiceSource. In a tenant that raises both, one section covers Defender and Purview together; our lab only had Defender for Endpoint alerts. Show it as a categorical bar chart, with ServiceSource on the x-axis and Severity as the series.
2. Alerts over time
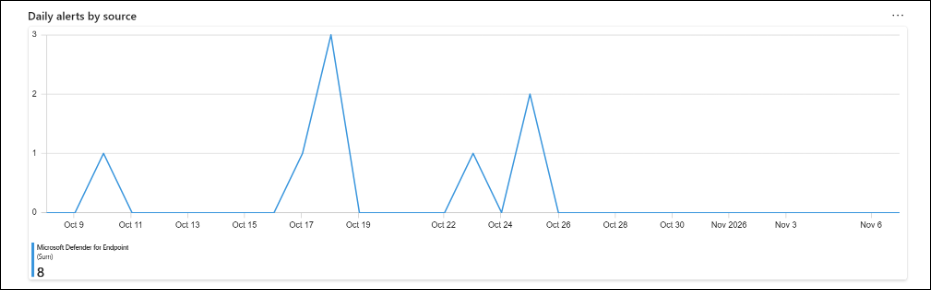
Alert volume day by day, so a sudden spike - or a product that has gone quiet - stands out.
AlertInfo
| where Timestamp > ago(30d)
| make-series Alerts = dcount(AlertId) default = 0 on Timestamp from startofday(ago(30d)) to now() step 1d by ServiceSource
make-series fills days with no alerts with zero, so the line drops to the axis instead of jumping between busy days. Show it as a time chart.
3. The alerts that keep coming back
A recurring alert is either a real problem nobody has fixed or noise that needs tuning - either way it needs an owner. This section lists the 20 most frequent.
AlertInfo
| where Timestamp > ago(30d)
| summarize Alerts = dcount(AlertId), LastSeen = max(Timestamp) by Title, ServiceSource, Severity
| top 20 by Alerts desc
In the lab, one alert - a connection to a custom network indicator - fired seven times in a month. That is exactly the kind of repeat that should be either fixed or tuned.

4. ASR rules - blocked and audited
Attack surface reduction rules run in one of two modes: audit, which only records what a rule would have blocked, and block, which stops it. This section shows each rule’s mode and how often it fires.
DeviceEvents
| where Timestamp > ago(30d)
| where ActionType startswith "Asr"
| extend Mode = iff(ActionType endswith "Audited", "Audit", "Block"),
         Rule = replace_regex(ActionType, @"^Asr|(Audited|Blocked)$", "")
| summarize Events = count(), Devices = dcount(DeviceId) by Rule, Mode
| order by Events desc
Rules that only ever appear in Audit are not protecting anything yet. Our lab returns no results here, which matches Part 2: with no ASR rules configured, there is nothing to audit or block. An empty section is a finding in itself.

5. Which audit rules are ready to block
Moving a rule from audit to block is where the protection comes from. This list ranks audit-mode rules by how many devices they affect, so you can start with the safest.
DeviceEvents
| where Timestamp > ago(30d)
| where ActionType startswith "Asr" and ActionType endswith "Audited"
| summarize Events = count(), Devices = dcount(DeviceId), TopProcesses = make_set(InitiatingProcessFileName, 5) by Rule = ActionType
| order by Devices asc, Events asc
The rules at the top touch the fewest devices - the easiest to switch to block. The TopProcesses column shows what would be blocked, so Contoso can decide on exclusions before changing the rule, not after.

Keep it current
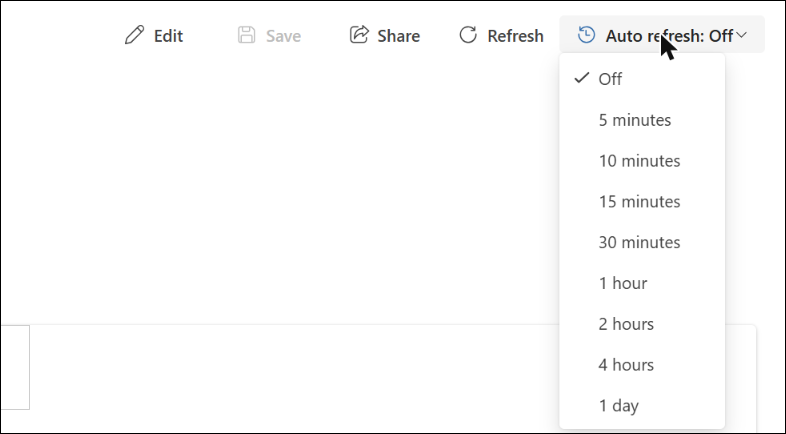
Select Auto refresh and choose an interval: 5, 10, 15 or 30 minutes, 1, 2 or 4 hours, or 1 day. Refresh pauses while the workbook is being edited and stops when it is closed. For a wall display in a security operations centre, 15 minutes is a sensible balance.
Build the next section with Copilot
Tenants with Security Copilot and available Security Compute Units see an Edit with Copilot option and can add sections by describing them in plain English. In edit mode, select Edit with Copilot and describe the result you want rather than the query, for example: “Add a bar chart of email messages blocked by Defender for Office 365 in the last 7 days, by threat type.” Copilot writes the KQL and the chart; review the query before saving, exactly as you would one you wrote yourself.
Key takeaways
- One page now shows alerts from across Defender - and Purview, where it raises them - instead of one portal page per product.
- A recurring alert needs an owner, not another acknowledgement.
- ASR rules only protect in block mode; their audit data tells you which rules are safe to switch.
The finished dashboard
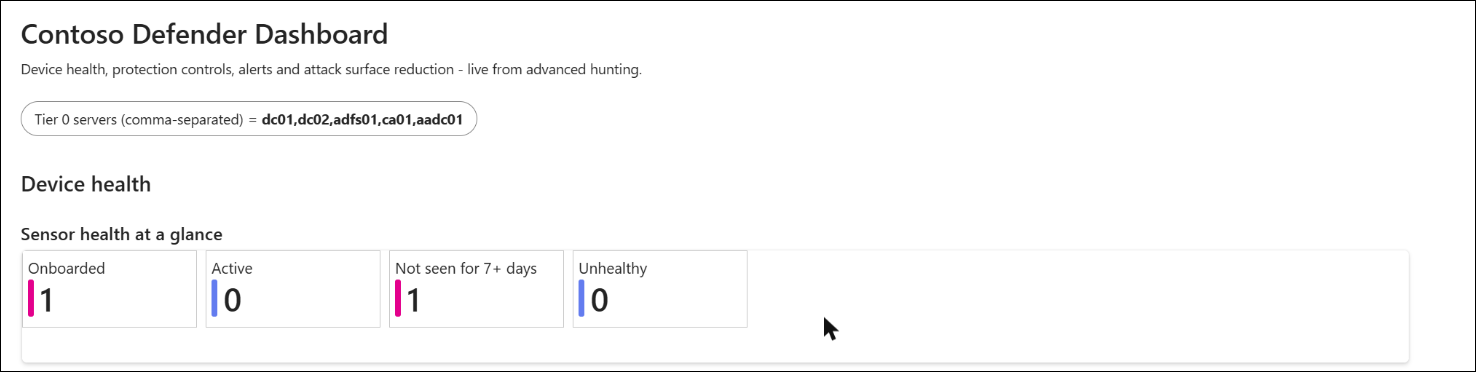
Contoso now has one page in the Defender portal that shows whether every device is reporting, whether the identity servers are covered, whether the protections are switched on, and what is raising alerts - built entirely from advanced hunting, with nothing extra to deploy. The finished workbook and every query are in the companion repository, linked below.
The rest of the series
- Series guide: Building a Defender Security Dashboard with Workbooks
- Part 1: Workbooks in the Defender portal, and device health
- Part 2: Are the protections actually on?
- Part 3: Alerts and attack surface reduction (this post)
The workbook and every KQL query from the series are on GitHub: github.com/cloud-secure-ai/Building-a-Defender-Security-Dashboard
References
- Create and manage workbooks in Microsoft Defender - Microsoft Learn
- Create and edit workbooks with Copilot in Microsoft Defender - Microsoft Learn
- AlertInfo table - Microsoft Learn
- Attack surface reduction rules reference - Microsoft Learn
Seán O’Farrell | cloud-secure.ai


Pingback: Defender Security Dashboard Part 2: Are the protections actually on? | Cloud-Secure.ai
Pingback: Building a Defender Security Dashboard with Workbooks: the series | Cloud-Secure.ai
Pingback: Defender Security Dashboard Part 1: Workbooks in the Defender portal, and device health | Cloud-Secure.ai