Series: This is Part 2 of 3 in my series on building a Defender security dashboard with workbooks. New to the series? Start with the series guide, which explains what the dashboard shows and what you need.
In plain terms: A device can be reporting in and still be unprotected - its antivirus standing back behind another product, its tamper protection off, or its attack-blocking rules never switched on. Defender already checks every one of these settings on every device. This part turns those checks into one colour-coded grid: green where a protection is on, red where it is not.
Part 1 showed which of Contoso’s devices are reporting - and caught one that is not. But a sensor that reports is not the same as a device that is protected.
Defender Vulnerability Management assesses each device’s protection settings against Microsoft’s recommended configuration. The results are in two advanced hunting tables, DeviceTvmSecureConfigurationAssessment and its reference table DeviceTvmSecureConfigurationAssessmentKB. This part turns them into one grid and three supporting views.
Protection controls
Add each query below as a query section, exactly as in Part 1: data source Advanced hunting, time range Set in query.
1. The control grid
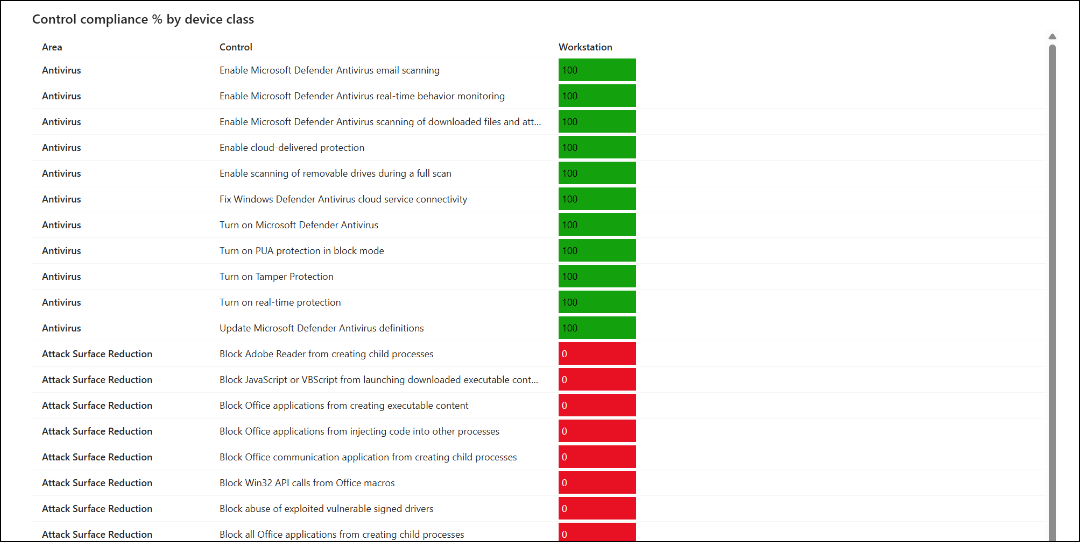
One grid for every protection control and every type of device. Each cell is the percentage of devices where that control is on.
let dcNames = split(tolower(replace_string("{IdentityServers}", " ", "")), ",");
let cls = DeviceInfo
| where Timestamp > ago(30d)
| summarize arg_max(Timestamp, DeviceName, DeviceType, OSPlatform) by DeviceId
| extend Host = tolower(tostring(split(DeviceName, ".")[0]))
| extend Class = case(Host in (dcNames), "Identity server", OSPlatform == "Linux", "Linux",
                      DeviceType == "Server", "Windows server", OSPlatform startswith "Windows", "Workstation", "Other")
| project DeviceId, Class;
DeviceTvmSecureConfigurationAssessment
| where IsApplicable
| join kind=inner cls on DeviceId
| join kind=inner (DeviceTvmSecureConfigurationAssessmentKB
    | project ConfigurationId, ConfigurationName, ConfigurationSubcategory) on ConfigurationId
| where ConfigurationSubcategory in ("Antivirus", "Attack Surface Reduction", "Bitlocker", "EDR",
                                     "Exploit Guard", "Firewall", "SmartScreen")
| summarize Pct = round(100.0 * countif(IsCompliant) / count(), 0) by Area = ConfigurationSubcategory, Control = ConfigurationName, Class
| evaluate pivot(Class, any(Pct), Area, Control)
| order by Area asc, Control asc
Show the result as a grid and apply a colour scale to the percentage columns - red at 0, green at 100. Identity servers get their own column through the IdentityServers parameter from Part 1, because a domain controller without these protections is a far bigger risk than a laptop without them.
In the lab, every antivirus control - including tamper protection - is green, and every attack surface reduction rule is red: Defender is running, but not one ASR rule is switched on.
A note on the categories
The queries filter on ConfigurationSubcategory, and the match is case-sensitive. The security control subcategories in our test tenant were Antivirus, Attack Surface Reduction, Bitlocker, EDR, Exploit Guard, Firewall, Onboard Devices and SmartScreen. Check the list in your own tenant before relying on the filter:
DeviceTvmSecureConfigurationAssessmentKB
| where ConfigurationCategory == "Security controls"
| summarize Controls = count() by ConfigurationSubcategory
2. The weakest controls
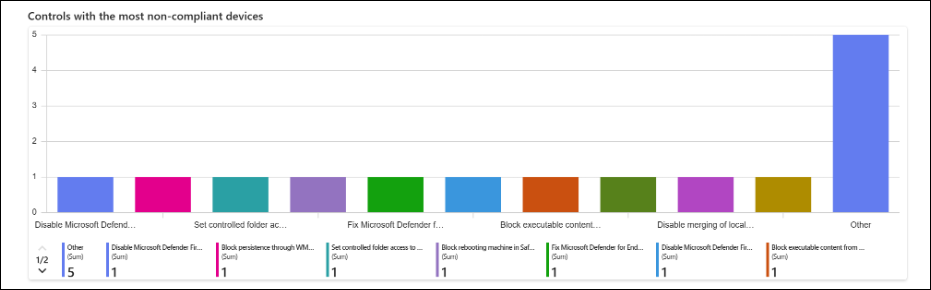
The grid shows percentages; this chart shows volume - the controls failing on the most devices, where one policy change fixes the most.
DeviceTvmSecureConfigurationAssessment
| where IsApplicable
| join kind=inner (DeviceTvmSecureConfigurationAssessmentKB
    | project ConfigurationId, ConfigurationName, ConfigurationSubcategory) on ConfigurationId
| where ConfigurationSubcategory in ("Antivirus", "Attack Surface Reduction", "Bitlocker", "EDR",
                                     "Exploit Guard", "Firewall", "SmartScreen")
| summarize NonCompliant = countif(not(IsCompliant)), Applicable = count() by ConfigurationName
| where NonCompliant > 0
| top 15 by NonCompliant desc
| project Control = ConfigurationName, NonCompliant
Show it as a categorical bar chart. The standard bar chart treats the control names as numbers and draws a single bar.
3. Antivirus mode
Whether Defender Antivirus is actively protecting each device, or standing back in passive mode behind another antivirus product.
DeviceTvmInfoGathering
| extend AvMode = case(tostring(AdditionalFields.AvMode) == "0", "Active",
                       tostring(AdditionalFields.AvMode) == "1", "Passive",
                       tostring(AdditionalFields.AvMode) == "4", "EDR in block mode", "Unknown")
| join kind=inner (DeviceInfo
    | where Timestamp > ago(30d)
    | summarize arg_max(Timestamp, OSPlatform) by DeviceId) on DeviceId
| summarize Devices = count() by OSPlatform, AvMode
| order by OSPlatform asc, Devices desc
Passive mode can be intended - during a migration from another product, for example - but it should be a decision, not a surprise. EDR in block mode lets Defender step in behind the other product when it misses something. Every device in passive mode should match a known exception.

4. Devices failing antivirus, tamper protection or EDR controls
A named list of devices failing the controls an attacker switches off first - antivirus and tamper protection - plus the EDR controls that let Defender see what happens next.
DeviceTvmSecureConfigurationAssessment
| where IsApplicable and not(IsCompliant)
| join kind=inner (DeviceTvmSecureConfigurationAssessmentKB
    | project ConfigurationId, ConfigurationName, ConfigurationSubcategory) on ConfigurationId
| where ConfigurationSubcategory in ("Antivirus", "EDR")
| summarize FailedControls = make_set(ConfigurationName) by DeviceName, OSPlatform
| extend Failed = array_length(FailedControls)
| order by Failed desc, DeviceName asc
Tamper protection sits within the Antivirus subcategory, so two subcategories cover all three. In the lab, the test device fails three EDR controls, including impaired communications - the same device Part 1 flagged as not seen for a week.

Key takeaways
- A device that reports is not necessarily protected - check the settings, not just the sensor.
- In the lab, antivirus was fully on but no attack surface reduction rules were configured - a common gap that one policy closes.
- A device failing EDR controls is a device Defender may not be able to see.
Next: Part 3
Part 3 completes the dashboard with what is actually happening: alerts by source, the alerts that keep coming back, attack surface reduction rules that are ready to block, and auto refresh.
The rest of the series
- Series guide: Building a Defender Security Dashboard with Workbooks
- Part 1: Workbooks in the Defender portal, and device health
- Part 2: Are the protections actually on? (this post)
- Part 3: Alerts and attack surface reduction
The workbook and every KQL query from the series are on GitHub: github.com/cloud-secure-ai/Building-a-Defender-Security-Dashboard
References
- Create and manage workbooks in Microsoft Defender - Microsoft Learn
- DeviceTvmSecureConfigurationAssessment table - Microsoft Learn
- Antivirus compatibility and passive mode - Microsoft Learn
Seán O’Farrell | cloud-secure.ai


Pingback: Defender Security Dashboard Part 3: Alerts and attack surface reduction | Cloud-Secure.ai
Pingback: Building a Defender Security Dashboard with Workbooks: the series | Cloud-Secure.ai
Pingback: Defender Security Dashboard Part 1: Workbooks in the Defender portal, and device health | Cloud-Secure.ai