Building a Defender Security Dashboard with Workbooks: the series

Building a Defender Security Dashboard with Workbooks: the series

One page that answers: how healthy is our security posture?

Ask the Contoso security team how healthy its security posture is, and the answer takes a tour of the portal. The device inventory, filtered by hand. The onboarding page. The security recommendations. The incidents queue. The attack surface reduction report. Every page answers part of the question, none of them answers all of it, and a manager asking for a weekly view gets a set of screenshots.

This series builds the alternative: a single page in the Microsoft Defender portal that answers the whole question, keeps itself up to date, and needs nothing extra installed to make it work.
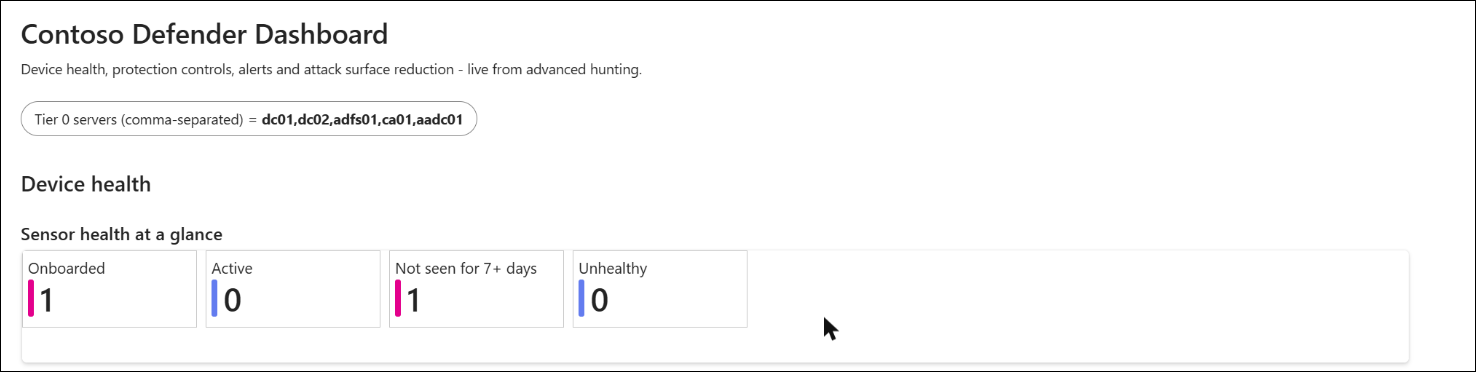
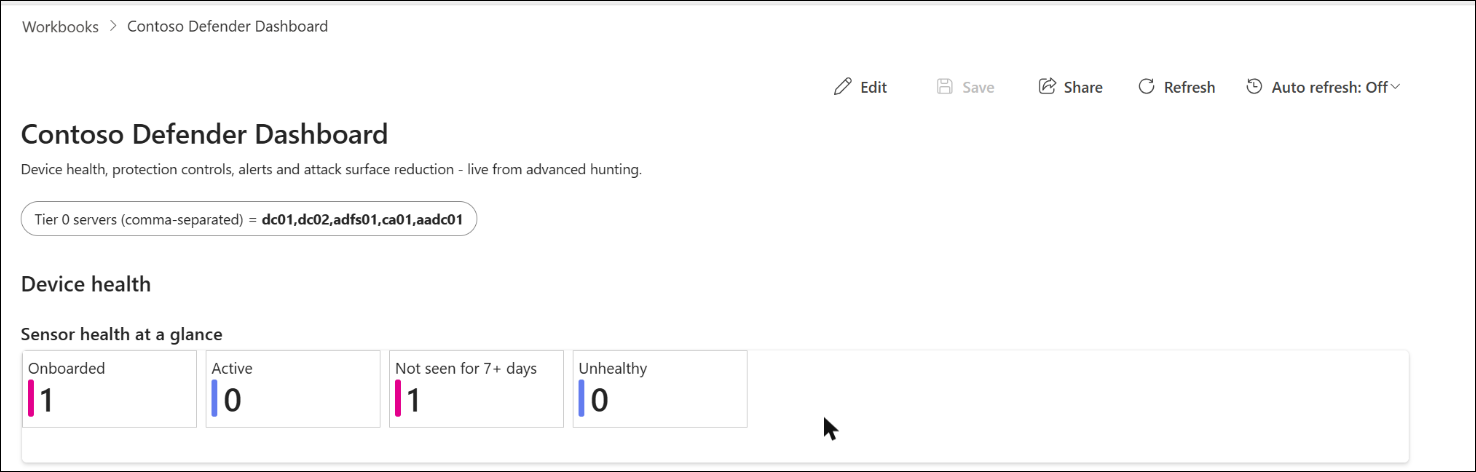
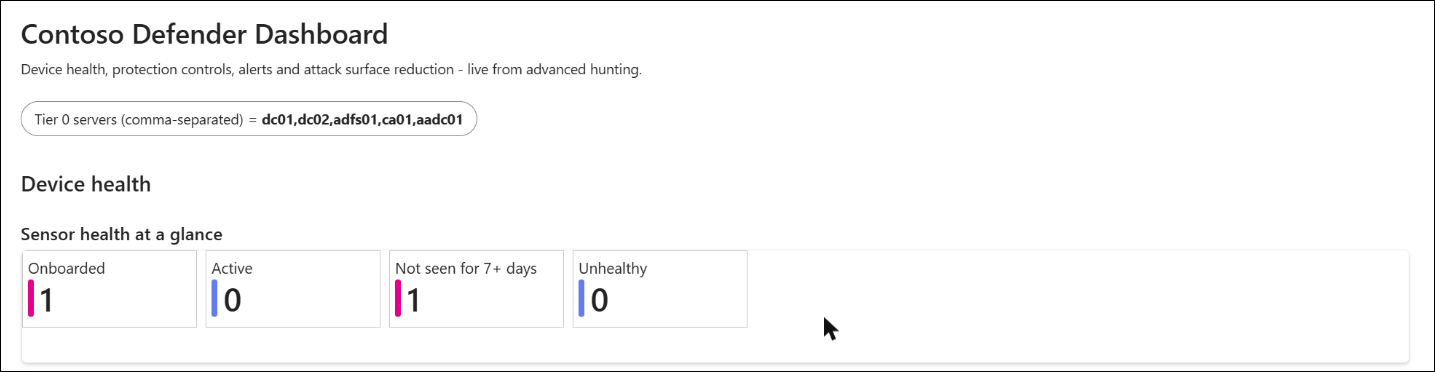
The finished dashboard - sensor health from the lab tenant

Who this series is for

The series is written for two kinds of reader, and each part works for both.

  • If you lead or manage security, read this guide and the In plain terms box and Key takeaways in each part. They explain what each section of the dashboard tells you and what good looks like - no code required.
  • If you run Defender day to day, each part gives you the queries, the settings and real screenshots to build the dashboard yourself - or import the finished version from GitHub in a few minutes.

What the dashboard shows

PartSectionQuestion it answers
1Device healthAre all our devices reporting in, and are the servers that control our identities covered?
2Protection controlsAre antivirus, tamper protection, attack surface reduction rules, BitLocker and the firewall actually switched on?
3Alerts and attack surface reductionWhat is raising alerts, and which attack-blocking rules are ready to move from test mode to blocking?

Each part adds one section to the same dashboard. Together they answer the question a manager actually asks: are we watching every device, are the protections on, and what is happening right now?
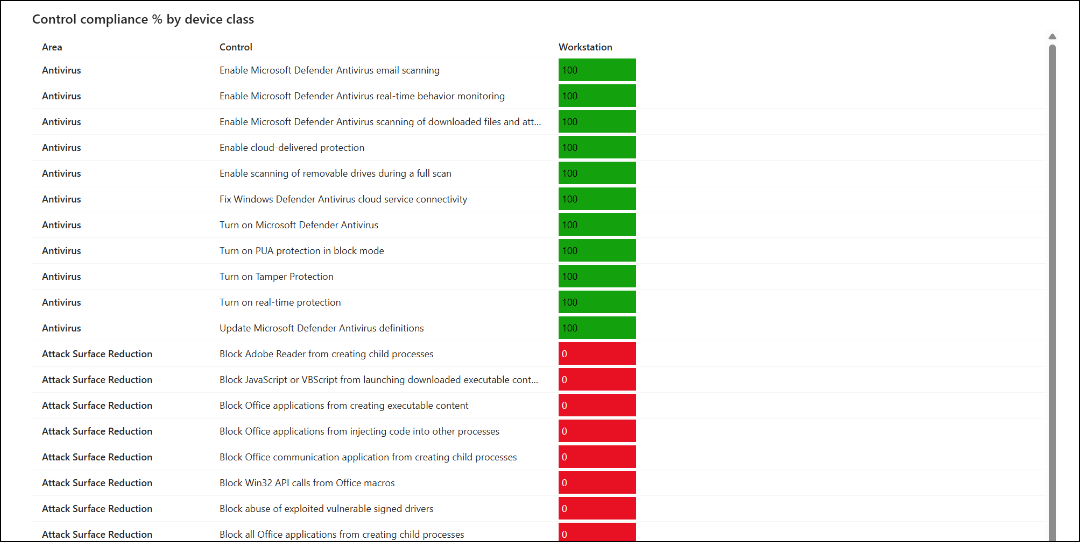
The control compliance grid from Part 2 - antivirus green, attack surface reduction rules red

The jargon, in one line each

TermWhat it means
Microsoft Defender portalMicrosoft’s security console (security.microsoft.com), where alerts, devices and investigations live
WorkbookA dashboard page inside the portal, built from charts and tables that update themselves
Advanced huntingThe portal’s search engine over the last 30 days of security data
KQLKusto Query Language - the language advanced hunting uses to ask questions of that data
SensorThe part of Defender for Endpoint on each device that reports what happens on it
Tier 0 serversThe few servers that control identity - domain controllers, AD CS, AD FS and Entra Connect. Compromise one and an attacker can reach everything
Tamper protectionA setting that stops anyone, including an attacker, switching Defender off
EDREndpoint detection and response - Defender’s ability to spot an attack in progress and act on it
ASR rulesAttack surface reduction rules - switches that block common attack techniques, such as an Office document launching a program
Defender Vulnerability ManagementThe part of Defender that checks every device’s settings against Microsoft’s recommended configuration

Why a workbook in the Defender portal

  • It reads advanced hunting directly. Every table Contoso already uses for hunting - device, vulnerability management, alert and event data - can drive a section. There is no data export, no Log Analytics workspace and no Azure resource to build first.
  • It is live. Each section runs its query whenever the workbook opens or refreshes, and auto refresh can rerun everything on a schedule, from every five minutes to once a day.
  • It respects each viewer’s access. A viewer sees only the data their own permissions allow, so the same workbook works for the central security team and for a regional team limited to its own devices.
  • It is shareable and portable. Workbooks are saved for the whole organisation, and the dashboard exports as one file that imports into another tenant in seconds.

Live data and history

Device, alert and event data is current to within minutes. The protection control sections read Defender Vulnerability Management assessments, which Defender updates on its own schedule rather than continuously. Advanced hunting keeps 30 days of data, so the dashboard shows the current state and the last month - which is exactly what a weekly review needs.

An example, not the limit

The three sections in this series are an example of what a Defender workbook can do, not a boundary. Any table in the advanced hunting schema can become a section, so the same approach extends well beyond device health and alerts. A few directions Contoso could take next:

Use caseAdvanced hunting tableWhat it could show
Sensitive file activity on devicesDeviceFileEventsFiles with a sensitivity label that were created, modified, renamed or copied, by label and by device
Purview data security signalsDataSecurityEvents (preview)Activity matched to sensitive information types and DLP policies, shared from Insider Risk Management
Generative AI app usageCloudAppEvents, DeviceNetworkEventsWhich users and devices use generative AI apps and services, and how often
Local AI agentsAgentsInfoAI agents discovered on onboarded devices, with their versions
Sign-in and email riskIdentityLogonEvents, EmailEventsFailed sign-ins on Tier 0 accounts, and phishing delivered or blocked

Each use case follows the same pattern as the sections in this series: write the query in advanced hunting, check the results, then add it to the workbook as a new section. Some tables depend on other products or settings - DataSecurityEvents, for example, is populated only when Insider Risk Management shares its alerts with Defender - so confirm a table returns data in your own tenant first.

Where the dashboard lives

The finished dashboard sits in the Defender portal under Workbooks (security.microsoft.com/sentinel/workbooks), alongside Microsoft’s example workbooks. Part 1 shows how to create it, save it and open it again.

What you need

  • Workbooks in the Defender portal. Available to tenants using Microsoft Sentinel in the Defender portal, and to tenants on the Integrated Security Operations Center (ISOC) preview - Microsoft Defender Suite, Microsoft 365 E5 or E7 without an active Sentinel workspace.
  • To build it: the Workbooks Unified RBAC permission with Manage access, or the Security Administrator role.
  • To view it: the Workbooks permission with Reader access, or the Security Reader role.
  • Data: devices onboarded to Defender for Endpoint, and Defender Vulnerability Management for the Part 2 controls.

How the series works

Every query is shown in full and explained in the post that uses it. Every screenshot comes from a real lab tenant, so you will see what the dashboard looks like with real gaps in it - including a device that has stopped reporting and a set of attack surface reduction rules that were never switched on.

If you would rather start with the finished product, the companion repository has the complete workbook as a single file, ready to import, together with every query as a .kql file.

GitHub: github.com/cloud-secure-ai/Building-a-Defender-Security-Dashboard

The series


References

Seรกn O’Farrell | cloud-secure.ai
Defender Security Dashboard Part 1: Workbooks in the Defender portal, and device health

Defender Security Dashboard Part 1: Workbooks in the Defender portal, and device health

Series: This is Part 1 of 3 in my series on building a Defender security dashboard with workbooks. New to the series? Start with the series guide, which explains what the dashboard shows and what you need.

In plain terms: Every device in the organisation should have a Defender sensor reporting in. A device that goes quiet is a blind spot: if it is attacked, nobody sees it, and Defender does not raise an alert to say it has stopped reporting. This part builds the first page of the dashboard, which answers two questions a manager can act on: are all our devices reporting, and are the servers that control our identities covered?

The series guide set out the goal: one page in the Defender portal that shows how healthy Contoso’s security posture is, built entirely on advanced hunting. This part creates the workbook and builds its first section - device health.

Workbooks in the Defender portal

A workbook is a dashboard page made of sections: text, parameters and queries. Each query section asks advanced hunting a question in KQL and shows the answer as a table, chart or tiles.

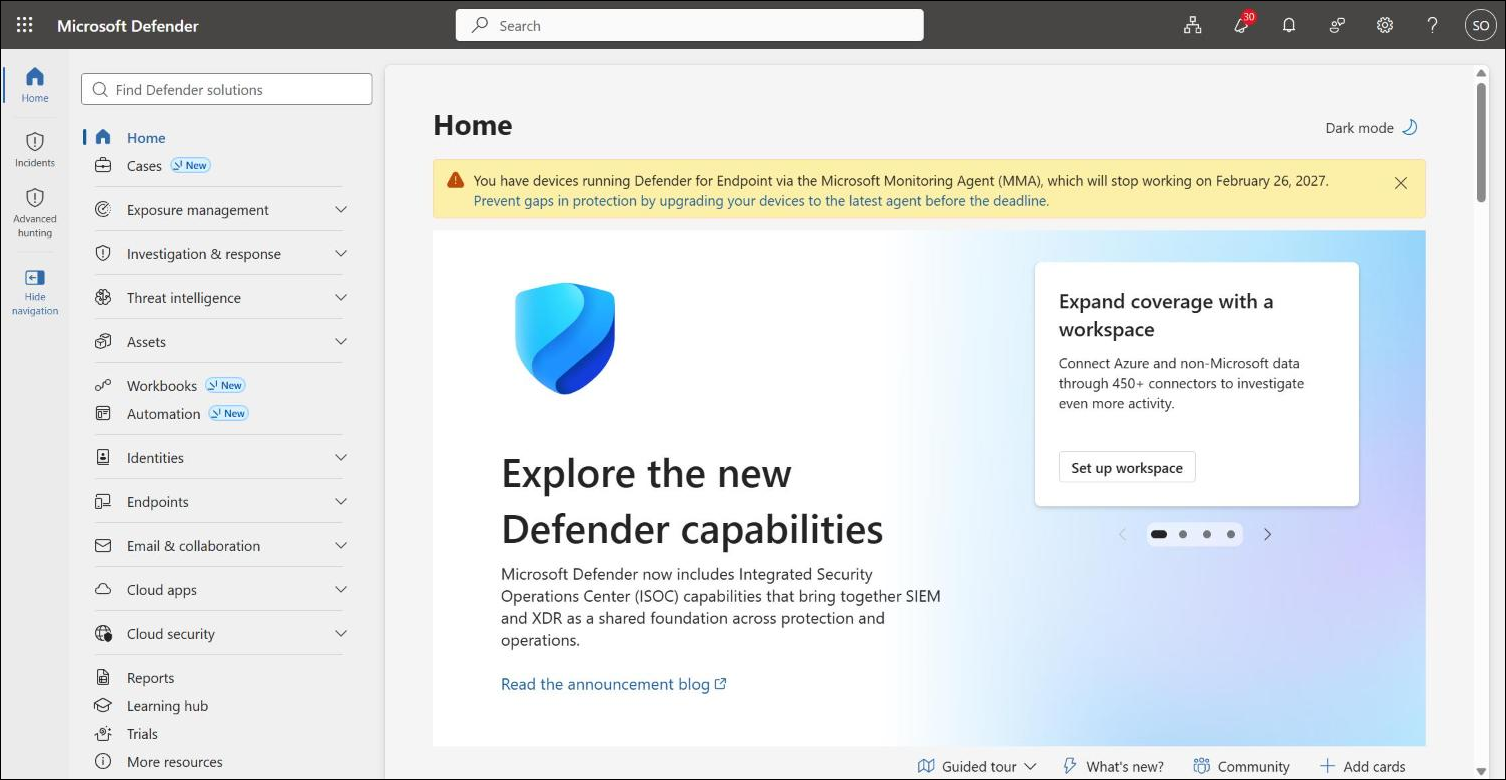
Workbooks in the Defender portal navigation

Workbooks sits in the Defender portal navigation. Tenants that use Microsoft Sentinel in the Defender portal reach it under Microsoft Sentinel; tenants on the Integrated Security Operations Center (ISOC) preview get it as a top-level item, as shown above, without needing a workspace.

Create the workbook

  1. Go to Workbooks and select + Add workbook, then Edit.
  2. Replace the default text with a heading such as Contoso Defender Dashboard.
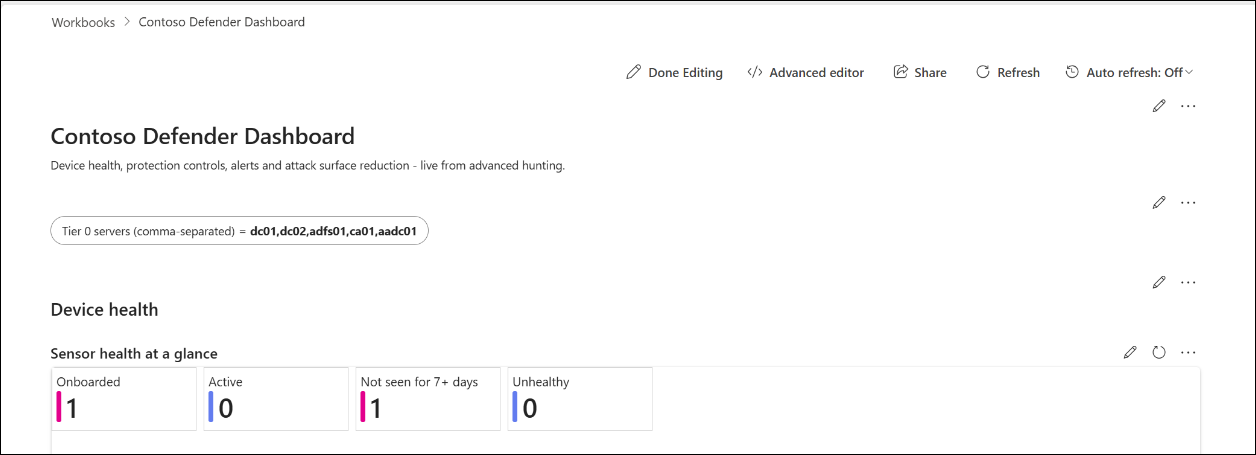
The workbook in edit mode, with Advanced editor in the toolbar

Save once, then reopen. In testing, every Save on an unsaved new workbook page created a separate copy. Save the first time, then open the workbook from the Workbooks list before making further changes.

Add a parameter for Tier 0 servers

Domain controllers, AD CS, AD FS and Entra Connect servers deserve their own view, and only Contoso knows their names. Add a parameters section with one text parameter called IdentityServers, and enter the short host names separated by commas, for example dc01,dc02,adfs01,ca01,aadc01. Queries in this series read it as {IdentityServers}.

The IdentityServers parameter under the workbook header

Device health

Each of the following is a query section: select Add, choose a query section, set Data source to Advanced hunting, leave Time range as Set in query, paste the query, select Run query, choose the visualisation and select Apply changes.

A query section in edit mode with Advanced hunting as the data source

Why 30 days? A device that stops reporting also stops appearing in short time windows, so a 7-day query quietly drops the very devices you are looking for. These queries look back 30 days for each device’s last record, and flag any device not seen for more than 7 days.

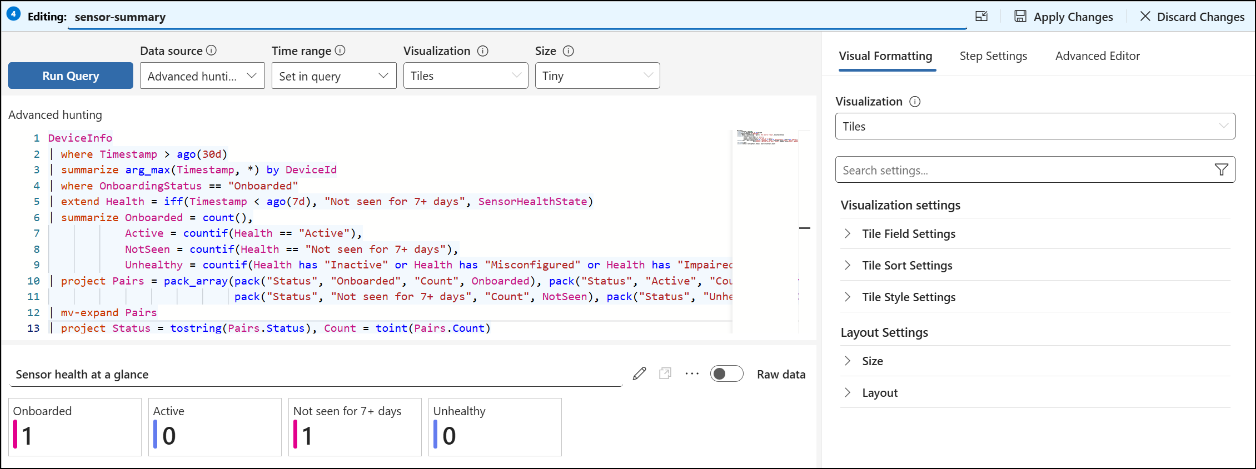
1. Sensor health at a glance

The headline: how many devices are onboarded, how many are reporting normally, and how many have gone quiet or report a problem.

DeviceInfo
| where Timestamp > ago(30d)
| summarize arg_max(Timestamp, *) by DeviceId
| where OnboardingStatus == "Onboarded"
| extend Health = iff(Timestamp < ago(7d), "Not seen for 7+ days", SensorHealthState)
| summarize Onboarded = count(),
            Active = countif(Health == "Active"),
            NotSeen = countif(Health == "Not seen for 7+ days"),
            Unhealthy = countif(Health has "Inactive" or Health has "Misconfigured" or Health has "Impaired")
| project Pairs = pack_array(pack("Status", "Onboarded", "Count", Onboarded), pack("Status", "Active", "Count", Active),
                             pack("Status", "Not seen for 7+ days", "Count", NotSeen), pack("Status", "Unhealthy", "Count", Unhealthy))
| mv-expand Pairs
| project Status = tostring(Pairs.Status), Count = toint(Pairs.Count)

Show this as tiles. The last two numbers should be close to zero. In the lab, the single test device has not reported for over a week, and the tile shows it immediately.

Sensor health tiles
Sensor health tiles

2. Sensor health by device class

The same numbers split by type of device, so it is clear where the problems sit.

DeviceInfo
| where Timestamp > ago(30d)
| summarize arg_max(Timestamp, *) by DeviceId
| where OnboardingStatus == "Onboarded"
| extend Health = iff(Timestamp < ago(7d), "Not seen for 7+ days", SensorHealthState)
| extend Class = case(DeviceType == "Server" and OSPlatform startswith "Windows", "Windows server",
                      OSPlatform == "Linux", "Linux",
                      DeviceType == "Workstation", strcat("Workstation - ", OSPlatform), OSPlatform)
| summarize Devices = count(),
            Active = countif(Health == "Active"),
            NotSeen = countif(Health == "Not seen for 7+ days"),
            Inactive = countif(Health == "Inactive"),
            Misconfigured = countif(Health has "Misconfigured"),
            Impaired = countif(Health has "Impaired") by Class
| order by Devices desc

Workstations that have not been seen are often laptops left switched off; a server that has not been seen almost never has a good reason.

Sensor health by device class table

3. Devices that have stopped reporting

The list that turns a number into a task: every device that has gone quiet or reports a problem, and how long it has been silent.

DeviceInfo
| where Timestamp > ago(30d)
| summarize arg_max(Timestamp, DeviceName, OSPlatform, DeviceType, SensorHealthState, OnboardingStatus, MachineGroup) by DeviceId
| where OnboardingStatus == "Onboarded"
| extend DaysSinceLastSeen = datetime_diff('day', now(), Timestamp)
| where SensorHealthState != "Active" or DaysSinceLastSeen >= 7
| project DeviceName, OSPlatform, DeviceType, SensorHealthState, LastSeen = Timestamp, DaysSinceLastSeen, DeviceGroup = MachineGroup
| order by DaysSinceLastSeen desc

The lab device still shows Active as its last sensor state - it simply stopped reporting, which is exactly why the 7-day check matters. Sort by DaysSinceLastSeen and work from the top: a device unseen for weeks is either retired, rebuilt under a new name, or a blind spot.

Devices not reporting a healthy sensor

4. Tier 0 identity servers

Domain controllers and the other identity servers are the keys to the kingdom. This section checks each one by name, so a server that was never onboarded shows up as a gap instead of simply being missing from the results.

let names = split(tolower(replace_string("{IdentityServers}", " ", "")), ",");
let seen = DeviceInfo
| where Timestamp > ago(30d)
| summarize arg_max(Timestamp, DeviceName, OSPlatform, ClientVersion, SensorHealthState, OnboardingStatus, MachineGroup) by DeviceId
| extend Host = tolower(tostring(split(DeviceName, ".")[0]))
| where Host in (names)
| project Host, DeviceName, OnboardingStatus, SensorHealthState, ClientVersion, DeviceGroup = MachineGroup, LastSeen = Timestamp;
print Host = names
| mv-expand Host to typeof(string)
| where isnotempty(Host)
| join kind=leftouter seen on Host
| extend Status = iff(OnboardingStatus == "Onboarded" and SensorHealthState == "Active" and LastSeen > ago(7d), "Healthy", "Needs attention")
| project Host, Status, OnboardingStatus, SensorHealthState, ClientVersion, DeviceGroup, LastSeen
| order by Status desc, Host asc

Show the result as a table, and use an icon format on the Status column so problems stand out. A server counts as healthy only if it is onboarded, its sensor is active and it has reported in the last 7 days. The lab has no domain controllers, so every name in the parameter shows Needs attention - exactly what a missing server would look like.

Tier 0 identity server coverage

5. Devices that can be onboarded

Defender also discovers devices on the network that are not yet protected. This section counts them by platform - the unmanaged devices attackers look for first.

DeviceInfo
| where Timestamp > ago(30d)
| summarize arg_max(Timestamp, OnboardingStatus, OSPlatform, DeviceType) by DeviceId
| where OnboardingStatus == "Can be onboarded"
| summarize Devices = count() by OSPlatform, DeviceType
| order by Devices desc

An empty result is good news. In the lab, device discovery found nothing waiting to be onboarded.

Devices that can be onboarded, by platform

Save it

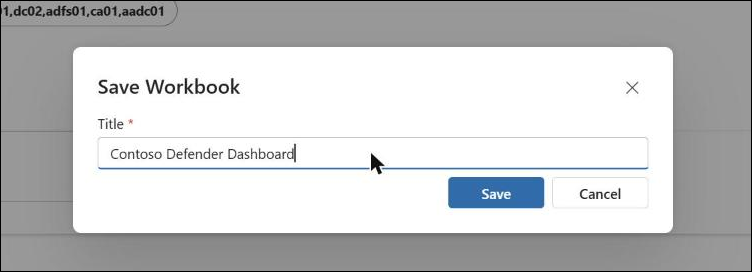
Select Done editing, then Save, and enter a title. The workbook is saved for the whole organisation and appears in the Workbooks list for anyone with Workbooks Reader access.

Save Workbook dialog

Opening the dashboard

  1. Sign in to the Microsoft Defender portal at security.microsoft.com.
  2. Select Workbooks in the navigation (under Microsoft Sentinel in Sentinel tenants), or browse directly to security.microsoft.com/sentinel/workbooks.
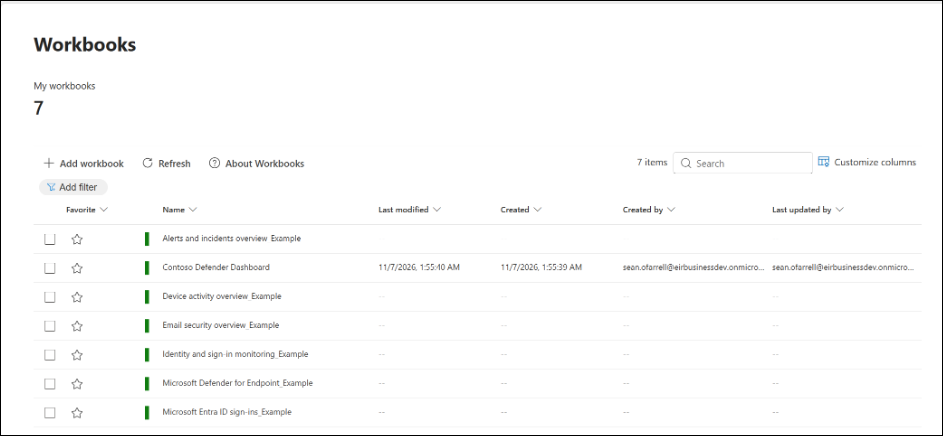
  3. Under My workbooks, select Contoso Defender Dashboard, then View saved workbook in the side panel.
The saved dashboard in the Workbooks list

Select the star next to the workbook to add it to your favourites, so it stays at the top of the list. Anyone with Workbooks Reader access, or the Security Reader role, sees the same workbook in their own list.

The shortcut: import the finished workbook

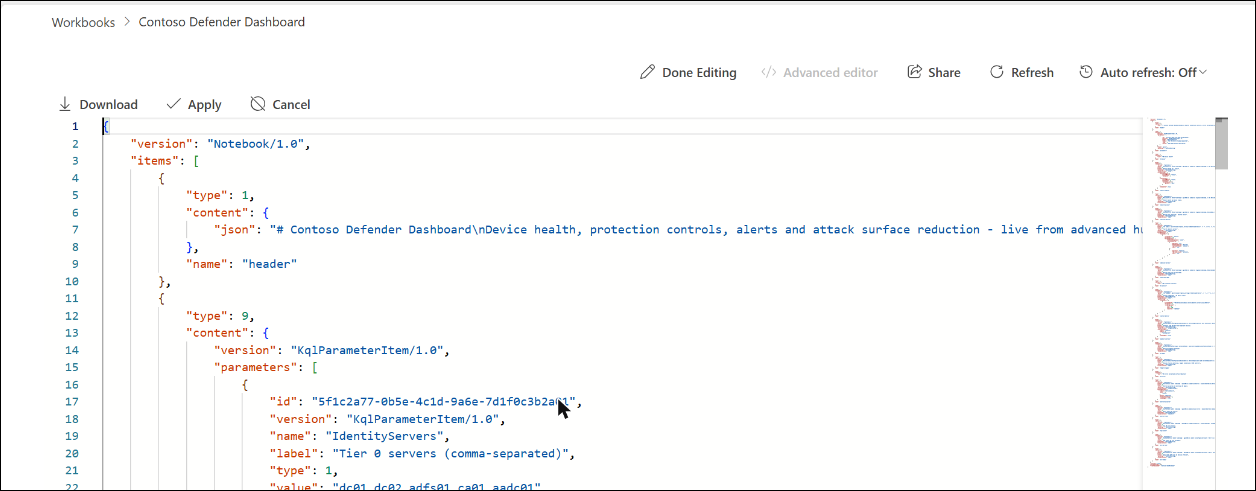
The complete dashboard from all three parts is in the companion repository as DefenderDashboard.workbook. Create a new workbook, select Edit, then Advanced editor, replace the JSON with the file’s contents and select Apply. Every query section uses "queryType": "advancedHunting", so it runs in any tenant with the same tables.

The workbook Advanced editor

Every query is also in the repository as its own .kql file, ready to run in advanced hunting. Those files cannot read a workbook parameter, so the two queries that use {IdentityServers} have a let line marked // EDIT instead, where you type your Tier 0 host names.

GitHub: github.com/cloud-secure-ai/Building-a-Defender-Security-Dashboard

Key takeaways

  • A device that stops reporting does not raise an alert - this section makes the silence visible.
  • Look back 30 days, not 7, or the devices you most need to find drop out of the results.
  • Check Tier 0 servers by name, so a server that was never onboarded shows up as a gap.

Next: Part 2

A device that reports is not the same as a device that is protected. Part 2 adds a single grid showing whether each protection is actually switched on, for every type of device.


The rest of the series

The workbook and every KQL query from the series are on GitHub: github.com/cloud-secure-ai/Building-a-Defender-Security-Dashboard

References

Seรกn O’Farrell | cloud-secure.ai
Defender Security Dashboard Part 2: Are the protections actually on?

Defender Security Dashboard Part 2: Are the protections actually on?

Series: This is Part 2 of 3 in my series on building a Defender security dashboard with workbooks. New to the series? Start with the series guide, which explains what the dashboard shows and what you need.

In plain terms: A device can be reporting in and still be unprotected - its antivirus standing back behind another product, its tamper protection off, or its attack-blocking rules never switched on. Defender already checks every one of these settings on every device. This part turns those checks into one colour-coded grid: green where a protection is on, red where it is not.

Part 1 showed which of Contoso’s devices are reporting - and caught one that is not. But a sensor that reports is not the same as a device that is protected.

Defender Vulnerability Management assesses each device’s protection settings against Microsoft’s recommended configuration. The results are in two advanced hunting tables, DeviceTvmSecureConfigurationAssessment and its reference table DeviceTvmSecureConfigurationAssessmentKB. This part turns them into one grid and three supporting views.

Protection controls

Add each query below as a query section, exactly as in Part 1: data source Advanced hunting, time range Set in query.

1. The control grid

One grid for every protection control and every type of device. Each cell is the percentage of devices where that control is on.

let dcNames = split(tolower(replace_string("{IdentityServers}", " ", "")), ",");
let cls = DeviceInfo
| where Timestamp > ago(30d)
| summarize arg_max(Timestamp, DeviceName, DeviceType, OSPlatform) by DeviceId
| extend Host = tolower(tostring(split(DeviceName, ".")[0]))
| extend Class = case(Host in (dcNames), "Identity server", OSPlatform == "Linux", "Linux",
                      DeviceType == "Server", "Windows server", OSPlatform startswith "Windows", "Workstation", "Other")
| project DeviceId, Class;
DeviceTvmSecureConfigurationAssessment
| where IsApplicable
| join kind=inner cls on DeviceId
| join kind=inner (DeviceTvmSecureConfigurationAssessmentKB
    | project ConfigurationId, ConfigurationName, ConfigurationSubcategory) on ConfigurationId
| where ConfigurationSubcategory in ("Antivirus", "Attack Surface Reduction", "Bitlocker", "EDR",
                                     "Exploit Guard", "Firewall", "SmartScreen")
| summarize Pct = round(100.0 * countif(IsCompliant) / count(), 0) by Area = ConfigurationSubcategory, Control = ConfigurationName, Class
| evaluate pivot(Class, any(Pct), Area, Control)
| order by Area asc, Control asc

Show the result as a grid and apply a colour scale to the percentage columns - red at 0, green at 100. Identity servers get their own column through the IdentityServers parameter from Part 1, because a domain controller without these protections is a far bigger risk than a laptop without them.

In the lab, every antivirus control - including tamper protection - is green, and every attack surface reduction rule is red: Defender is running, but not one ASR rule is switched on.

Control compliance grid with colour scale

A note on the categories

The queries filter on ConfigurationSubcategory, and the match is case-sensitive. The security control subcategories in our test tenant were Antivirus, Attack Surface Reduction, Bitlocker, EDR, Exploit Guard, Firewall, Onboard Devices and SmartScreen. Check the list in your own tenant before relying on the filter:

DeviceTvmSecureConfigurationAssessmentKB
| where ConfigurationCategory == "Security controls"
| summarize Controls = count() by ConfigurationSubcategory

2. The weakest controls

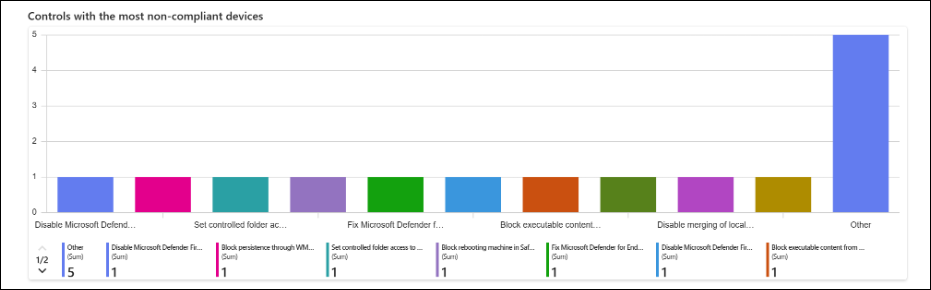
The grid shows percentages; this chart shows volume - the controls failing on the most devices, where one policy change fixes the most.

DeviceTvmSecureConfigurationAssessment
| where IsApplicable
| join kind=inner (DeviceTvmSecureConfigurationAssessmentKB
    | project ConfigurationId, ConfigurationName, ConfigurationSubcategory) on ConfigurationId
| where ConfigurationSubcategory in ("Antivirus", "Attack Surface Reduction", "Bitlocker", "EDR",
                                     "Exploit Guard", "Firewall", "SmartScreen")
| summarize NonCompliant = countif(not(IsCompliant)), Applicable = count() by ConfigurationName
| where NonCompliant > 0
| top 15 by NonCompliant desc
| project Control = ConfigurationName, NonCompliant

Show it as a categorical bar chart. The standard bar chart treats the control names as numbers and draws a single bar.

Top 15 controls by non-compliant devices

3. Antivirus mode

Whether Defender Antivirus is actively protecting each device, or standing back in passive mode behind another antivirus product.

DeviceTvmInfoGathering
| extend AvMode = case(tostring(AdditionalFields.AvMode) == "0", "Active",
                       tostring(AdditionalFields.AvMode) == "1", "Passive",
                       tostring(AdditionalFields.AvMode) == "4", "EDR in block mode", "Unknown")
| join kind=inner (DeviceInfo
    | where Timestamp > ago(30d)
    | summarize arg_max(Timestamp, OSPlatform) by DeviceId) on DeviceId
| summarize Devices = count() by OSPlatform, AvMode
| order by OSPlatform asc, Devices desc

Passive mode can be intended - during a migration from another product, for example - but it should be a decision, not a surprise. EDR in block mode lets Defender step in behind the other product when it misses something. Every device in passive mode should match a known exception.

Antivirus mode by platform

4. Devices failing antivirus, tamper protection or EDR controls

A named list of devices failing the controls an attacker switches off first - antivirus and tamper protection - plus the EDR controls that let Defender see what happens next.

DeviceTvmSecureConfigurationAssessment
| where IsApplicable and not(IsCompliant)
| join kind=inner (DeviceTvmSecureConfigurationAssessmentKB
    | project ConfigurationId, ConfigurationName, ConfigurationSubcategory) on ConfigurationId
| where ConfigurationSubcategory in ("Antivirus", "EDR")
| summarize FailedControls = make_set(ConfigurationName) by DeviceName, OSPlatform
| extend Failed = array_length(FailedControls)
| order by Failed desc, DeviceName asc

Tamper protection sits within the Antivirus subcategory, so two subcategories cover all three. In the lab, the test device fails three EDR controls, including impaired communications - the same device Part 1 flagged as not seen for a week.

Devices failing antivirus, tamper protection or EDR controls

Key takeaways

  • A device that reports is not necessarily protected - check the settings, not just the sensor.
  • In the lab, antivirus was fully on but no attack surface reduction rules were configured - a common gap that one policy closes.
  • A device failing EDR controls is a device Defender may not be able to see.

Next: Part 3

Part 3 completes the dashboard with what is actually happening: alerts by source, the alerts that keep coming back, attack surface reduction rules that are ready to block, and auto refresh.


The rest of the series

The workbook and every KQL query from the series are on GitHub: github.com/cloud-secure-ai/Building-a-Defender-Security-Dashboard

References

Seรกn O’Farrell | cloud-secure.ai
Defender Security Dashboard Part 3: Alerts and attack surface reduction

Defender Security Dashboard Part 3: Alerts and attack surface reduction

Series: This is Part 3 of 3 in my series on building a Defender security dashboard with workbooks. New to the series? Start with the series guide, which explains what the dashboard shows and what you need.

In plain terms: The first two parts showed whether devices are being watched and whether their protections are on. This part shows what is actually happening: which security products are raising alerts, which alerts keep repeating, and which attack-blocking rules are ready to move from test mode (audit) to blocking. It also sets the dashboard to refresh itself, so it can sit on a screen in the security team’s office.

Alerts and attack surface reduction

As in Parts 1 and 2, add each query below as a query section with Advanced hunting as the data source and the time range Set in query.

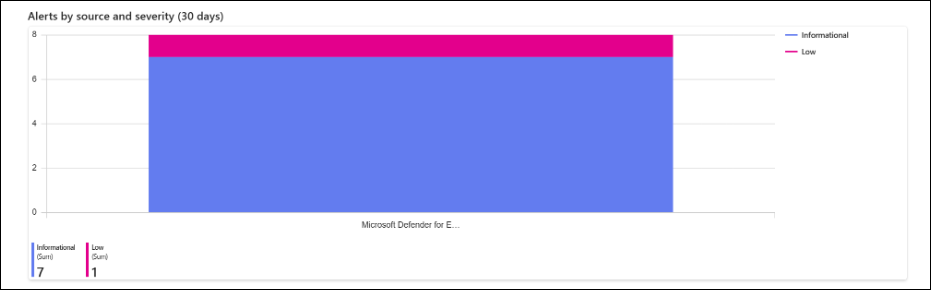
1. Alerts by source and severity

Which products are raising alerts, and how serious those alerts are.

AlertInfo
| where Timestamp > ago(30d)
| summarize Alerts = dcount(AlertId) by ServiceSource, Severity
| order by Alerts desc

AlertInfo holds alerts from across Microsoft Defender XDR, and Microsoft Purview alerts, such as Data Loss Prevention and Insider Risk Management, can appear there too, each with its own ServiceSource. In a tenant that raises both, one section covers Defender and Purview together; our lab only had Defender for Endpoint alerts. Show it as a categorical bar chart, with ServiceSource on the x-axis and Severity as the series.

Alerts by source and severity

2. Alerts over time

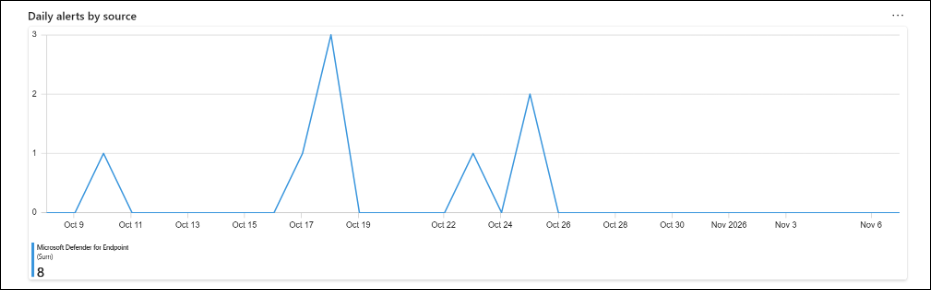
Alert volume day by day, so a sudden spike - or a product that has gone quiet - stands out.

AlertInfo
| where Timestamp > ago(30d)
| make-series Alerts = dcount(AlertId) default = 0 on Timestamp from startofday(ago(30d)) to now() step 1d by ServiceSource

make-series fills days with no alerts with zero, so the line drops to the axis instead of jumping between busy days. Show it as a time chart.

Daily alerts by source over 30 days

3. The alerts that keep coming back

A recurring alert is either a real problem nobody has fixed or noise that needs tuning - either way it needs an owner. This section lists the 20 most frequent.

AlertInfo
| where Timestamp > ago(30d)
| summarize Alerts = dcount(AlertId), LastSeen = max(Timestamp) by Title, ServiceSource, Severity
| top 20 by Alerts desc

In the lab, one alert - a connection to a custom network indicator - fired seven times in a month. That is exactly the kind of repeat that should be either fixed or tuned.

Top 20 alert titles
Top 20 alert titles

4. ASR rules - blocked and audited

Attack surface reduction rules run in one of two modes: audit, which only records what a rule would have blocked, and block, which stops it. This section shows each rule’s mode and how often it fires.

DeviceEvents
| where Timestamp > ago(30d)
| where ActionType startswith "Asr"
| extend Mode = iff(ActionType endswith "Audited", "Audit", "Block"),
         Rule = replace_regex(ActionType, @"^Asr|(Audited|Blocked)$", "")
| summarize Events = count(), Devices = dcount(DeviceId) by Rule, Mode
| order by Events desc

Rules that only ever appear in Audit are not protecting anything yet. Our lab returns no results here, which matches Part 2: with no ASR rules configured, there is nothing to audit or block. An empty section is a finding in itself.

ASR events by rule and mode

5. Which audit rules are ready to block

Moving a rule from audit to block is where the protection comes from. This list ranks audit-mode rules by how many devices they affect, so you can start with the safest.

DeviceEvents
| where Timestamp > ago(30d)
| where ActionType startswith "Asr" and ActionType endswith "Audited"
| summarize Events = count(), Devices = dcount(DeviceId), TopProcesses = make_set(InitiatingProcessFileName, 5) by Rule = ActionType
| order by Devices asc, Events asc

The rules at the top touch the fewest devices - the easiest to switch to block. The TopProcesses column shows what would be blocked, so Contoso can decide on exclusions before changing the rule, not after.

Audit-mode ASR rules by devices affected

Keep it current

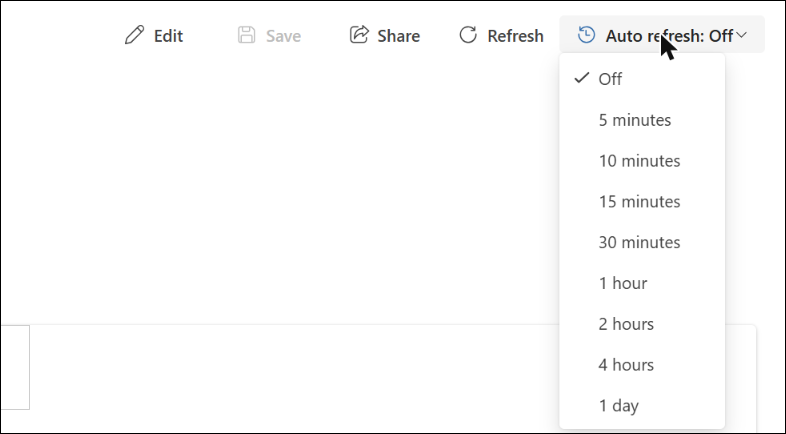
Select Auto refresh and choose an interval: 5, 10, 15 or 30 minutes, 1, 2 or 4 hours, or 1 day. Refresh pauses while the workbook is being edited and stops when it is closed. For a wall display in a security operations centre, 15 minutes is a sensible balance.

Auto refresh interval options

Build the next section with Copilot

Tenants with Security Copilot and available Security Compute Units see an Edit with Copilot option and can add sections by describing them in plain English. In edit mode, select Edit with Copilot and describe the result you want rather than the query, for example: “Add a bar chart of email messages blocked by Defender for Office 365 in the last 7 days, by threat type.” Copilot writes the KQL and the chart; review the query before saving, exactly as you would one you wrote yourself.

Key takeaways

  • One page now shows alerts from across Defender - and Purview, where it raises them - instead of one portal page per product.
  • A recurring alert needs an owner, not another acknowledgement.
  • ASR rules only protect in block mode; their audit data tells you which rules are safe to switch.

The finished dashboard

Contoso now has one page in the Defender portal that shows whether every device is reporting, whether the identity servers are covered, whether the protections are switched on, and what is raising alerts - built entirely from advanced hunting, with nothing extra to deploy. The finished workbook and every query are in the companion repository, linked below.

The finished dashboard in the lab tenant

The rest of the series

The workbook and every KQL query from the series are on GitHub: github.com/cloud-secure-ai/Building-a-Defender-Security-Dashboard

References

Seรกn O’Farrell | cloud-secure.ai