How to rehearse machine isolation and remediation before a real incident forces you to learn it.
Most security teams never run machine isolation in anger until the day they have to, and that is the worst possible moment to learn it. The buttons are unfamiliar, the device drops off the network, and everyone is watching. This series removes that risk by rehearsing the whole flow in a safe lab, end to end, so the real thing is muscle memory.
Across four parts we onboard a test device, generate a clean incident, isolate the machine, remediate it through Live Response, and then recover a device that has locked everyone out:
- Part 1 – Building the lab (this post)
- Part 2 – Generating a clean incident
- Part 3 – Isolation and remediation through Live Response
- Part 4 – Recovering a device locked out of RDP
Everything runs in a dedicated lab tenant. The KQL queries and PowerShell scripts are in a companion repository, linked at the end.
The lab
The lab is a single Azure-hosted Windows 11 virtual machine, Entra joined, managed by Intune, and onboarded to Microsoft Defender for Endpoint. One VM is enough to show every response action in the series.
Hosting it in Azure matters later. When a device is isolated it keeps only its connection to the Defender service, so Remote Desktop and Bastion both drop. Azure still gives us an out-of-band way to see the machine, which an on-premises laptop would not have. We enable that view below, before we need it.
Licensing
Live Response, device isolation and the full set of response actions require Microsoft Defender for Endpoint Plan 2, which is included in Microsoft 365 E5. Plan 1 covers isolation and an antivirus scan, but not Live Response.
Confirm the exact licence SKU in your own tenant before publishing.
Turning on the response features
The response features live under Settings > Endpoints > Advanced features. Four settings matter for this series.
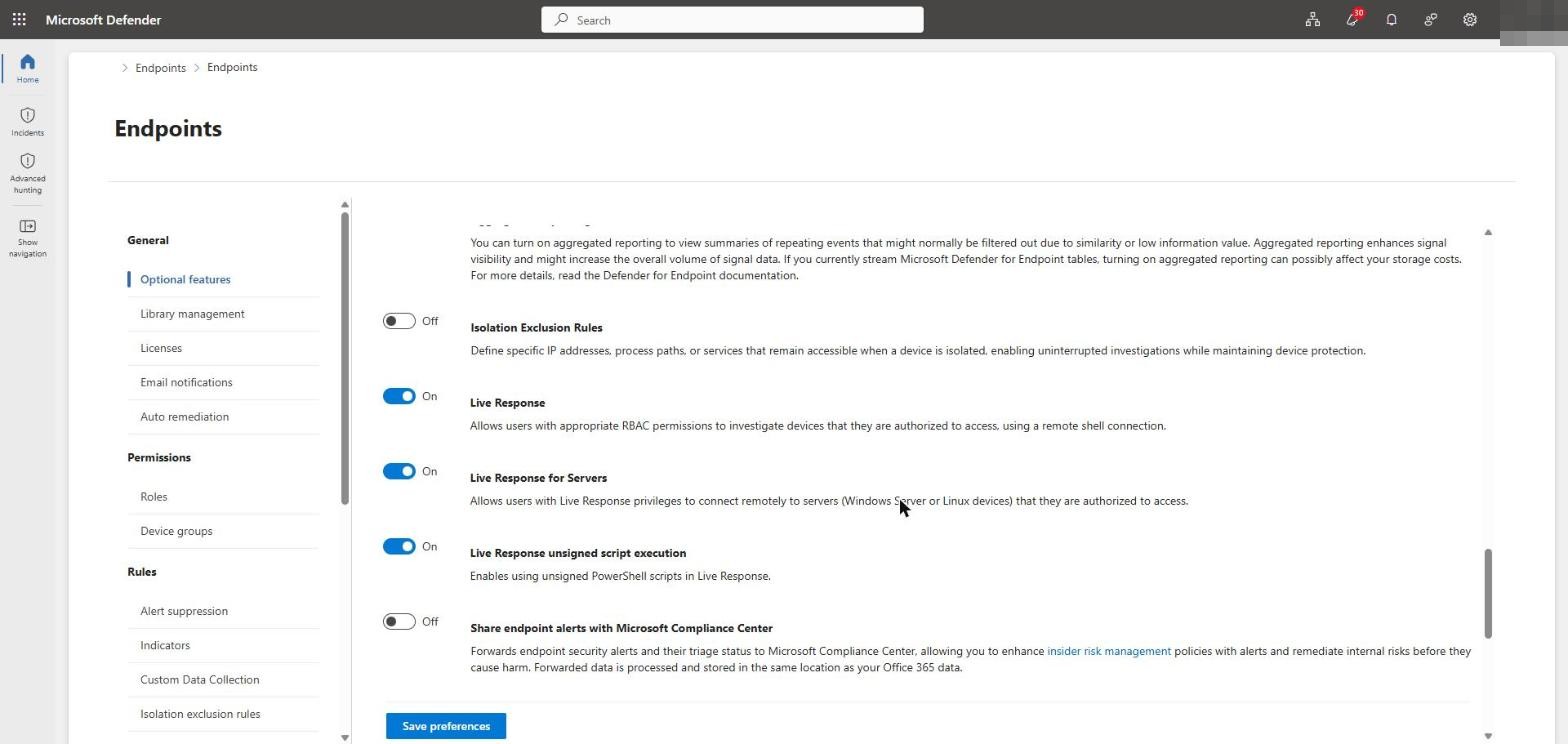
- Live Response – the remote shell from the Defender portal to the device. Required for everything in Parts 3 and 4.
- Live Response for Servers – only needed for server operating systems. A Windows 11 client does not need it.
- Live Response unsigned script execution – allows unsigned scripts to run from the library. Convenient in a lab, but signing your scripts and leaving this off is the better habit, and it is the approach the companion repo is built for.
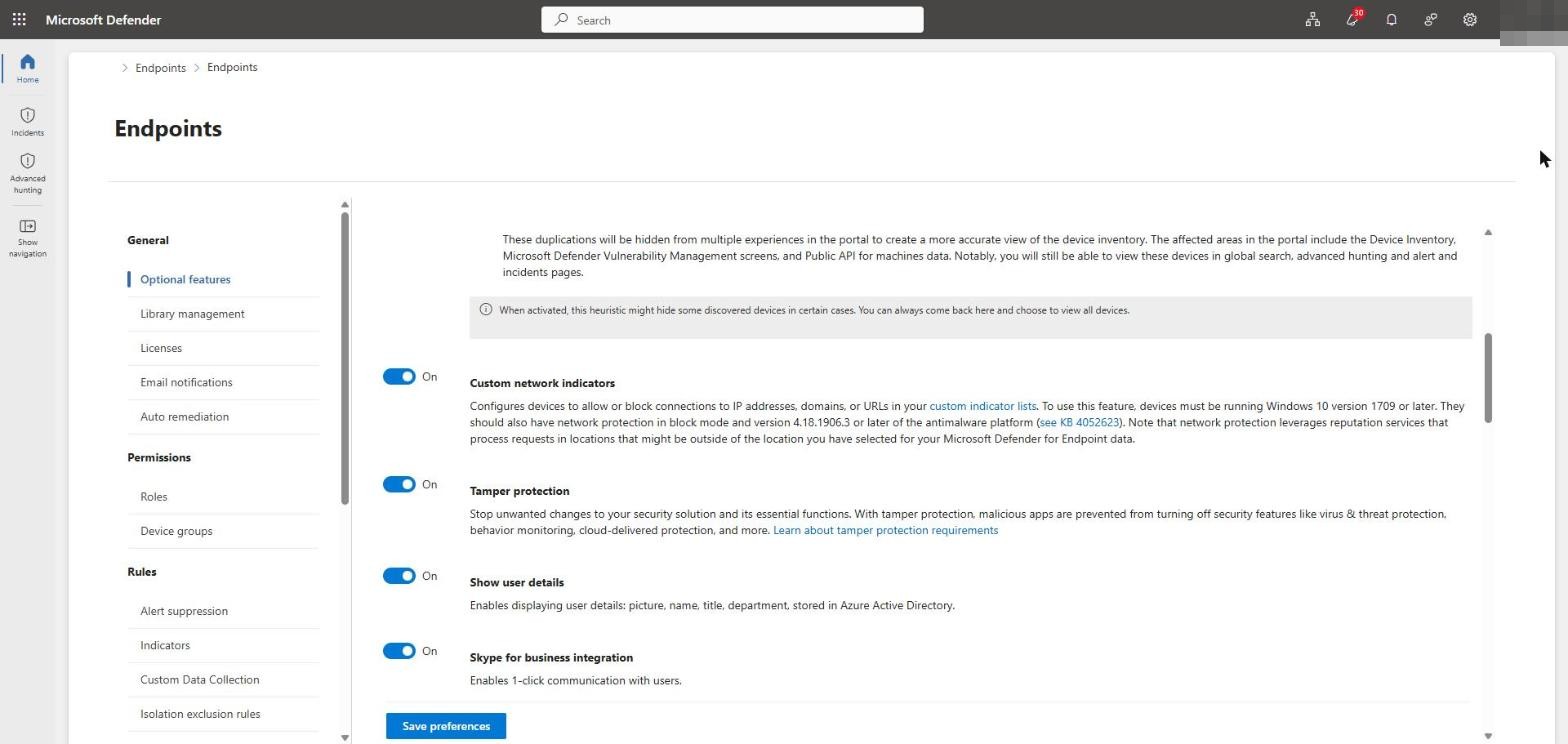
Tamper protection should be on. It stops malicious apps turning off core Defender features. It is worth knowing its limits now, because they shape Part 4: tamper protection guards virus and threat protection, real-time protection and behaviour monitoring. It does not guard the Windows Firewall or the Remote Desktop registry settings that we deliberately break later.
One newer setting is worth noting: Isolation Exclusion Rules, off by default, lets you name IP addresses, processes or services that stay reachable while a device is isolated. We leave it off for a true isolation.
Role-based access
Live Response is gated by role. Basic permissions allow the read-only commands, such as listing processes, services and registry values. Advanced permissions allow run, putfile and remediate, which are the commands that actually change the device. Assign the advanced role to whoever will perform the remediation.
Preparing an out-of-band view
Because isolation cuts Remote Desktop, set up an out-of-band view of the VM before you need it. Two Azure features cover this.
Boot diagnostics
Boot diagnostics gives you a console screenshot of the VM even when the network is cut:
- Azure portal > the VM > Help > Boot diagnostics > Settings
- Choose Enable with managed storage account (recommended), then Save
- The Screenshot tab then shows a live console image on demand
Serial console (optional)
The serial console gives an interactive text session and needs boot diagnostics plus SAC/EMS. On Windows client editions, enable EMS first:
bcdedit /ems {current} on
bcdedit /emssettings EMSPORT:1 EMSBAUDRATE:115200
# then reboot
After the reboot, the VM > Help > Serial console gives a text console you can reach even with RDP blocked. For most of this series the boot diagnostics screenshot is enough, so treat the serial console as an advanced option.
Verify the serial console steps in your own tenant, and blur the subscription name and ID on any Azure screenshots.
Confirming the sensor is reporting
Before relying on the device, confirm it is actually talking to Defender. On the VM, the Sense and DiagTrack services should both be Running, and the onboarding state should be 1:
Get-Service Sense, DiagTrack | Format-Table Name, Status, StartType
(Get-ItemProperty 'HKLM:\SOFTWARE\Microsoft\Windows Advanced Threat Protection\Status').OnboardingState
The definitive test is a Live Response session. From the device page, choose the actions menu and Initiate Live Response session.
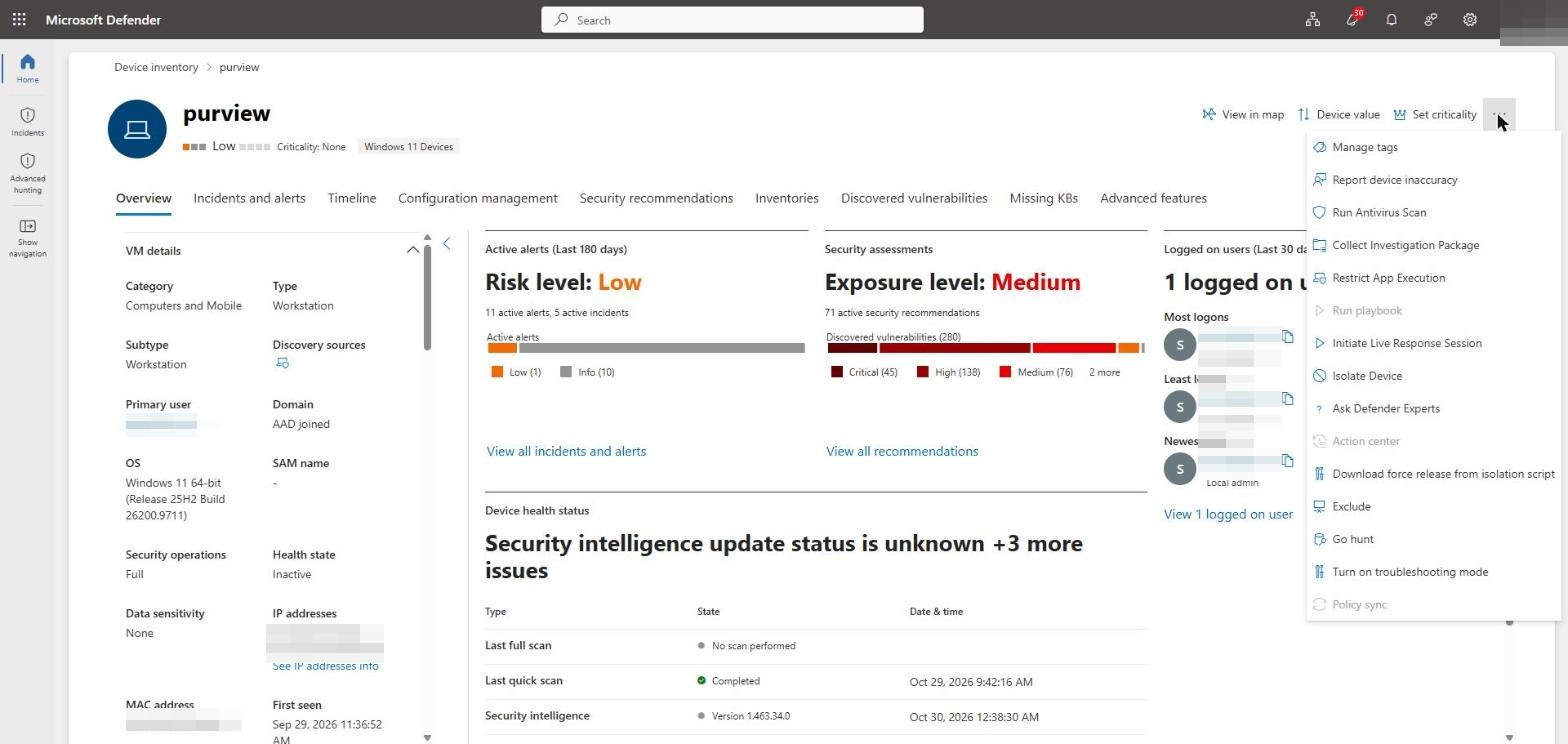
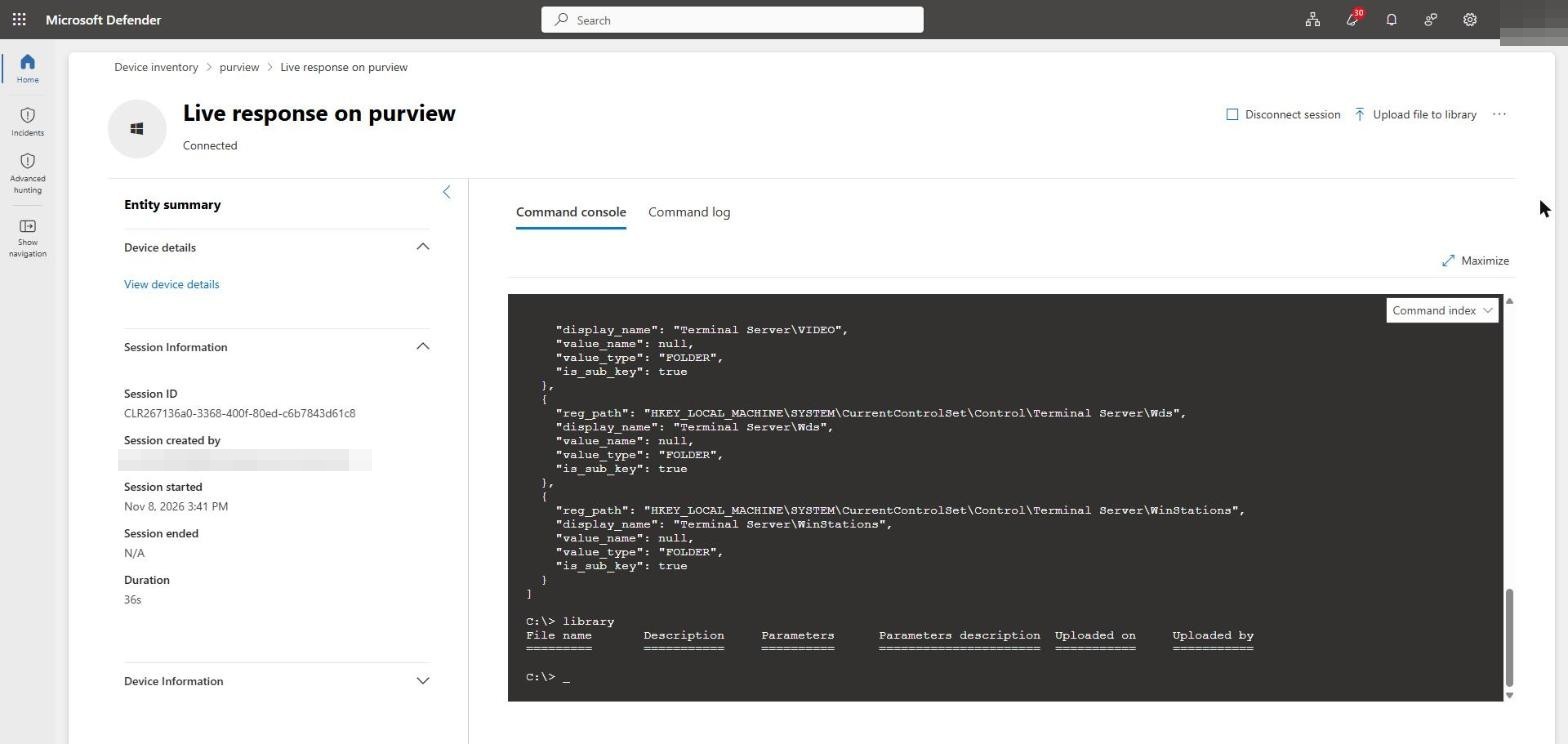
A session that connects, with an empty library, confirms the cloud channel works end to end. The device can show as Inactive in the portal for a while after a reboot, so a working Live Response session is a more reliable signal than the health state.
The companion repository
The KQL queries and PowerShell scripts for the series are in a public repository:
github.com/cloud-secure-ai/mde-isolation-live-response-lab
Next
With the lab onboarded and the response features on, Part 2 generates a clean, reproducible incident on the device, without running any real malware.

